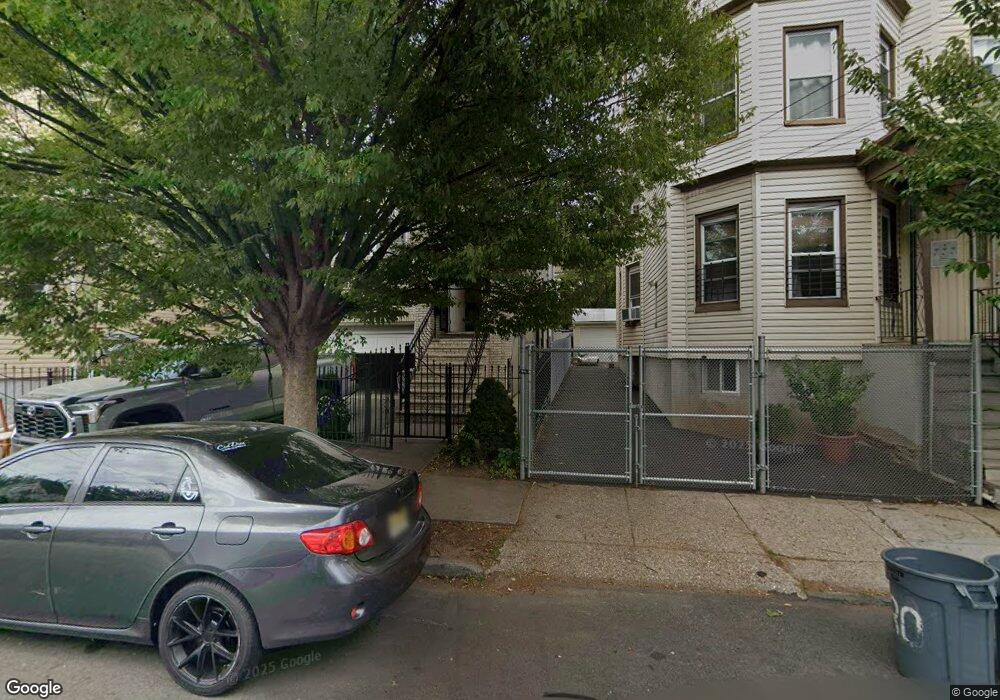
76 4th St Unit 78 Newark, NJ 07107
Fairmount NeighborhoodEstimated Value: $613,000 - $704,000
--
Bed
--
Bath
3,016
Sq Ft
$223/Sq Ft
Est. Value
About This Home
This home is located at 76 4th St Unit 78, Newark, NJ 07107 and is currently estimated at $671,113, approximately $222 per square foot. 76 4th St Unit 78 is a home located in Essex County with nearby schools including Sir Isaac Newton Elementary School, Camden Street Elementary School, and Cleveland Elementary School.
Ownership History
Date
Name
Owned For
Owner Type
Purchase Details
Closed on
Jun 28, 2010
Sold by
Beltway Capital Llc
Bought by
Rivas Jose
Current Estimated Value
Home Financials for this Owner
Home Financials are based on the most recent Mortgage that was taken out on this home.
Original Mortgage
$220,924
Outstanding Balance
$147,539
Interest Rate
4.82%
Mortgage Type
FHA
Estimated Equity
$523,574
Purchase Details
Closed on
Oct 6, 2009
Sold by
Newandu Franklin
Bought by
Beltway Capital Llc
Purchase Details
Closed on
Aug 17, 2006
Sold by
Jb Construction Inc
Bought by
Newandu Franklin
Home Financials for this Owner
Home Financials are based on the most recent Mortgage that was taken out on this home.
Original Mortgage
$386,750
Interest Rate
6.47%
Purchase Details
Closed on
Aug 18, 2004
Sold by
City Of Newark
Bought by
Jb Construction Inc
Create a Home Valuation Report for This Property
The Home Valuation Report is an in-depth analysis detailing your home's value as well as a comparison with similar homes in the area
Home Values in the Area
Average Home Value in this Area
Purchase History
| Date | Buyer | Sale Price | Title Company |
|---|---|---|---|
| Rivas Jose | $225,000 | None Available | |
| Beltway Capital Llc | -- | None Available | |
| Newandu Franklin | $455,000 | -- | |
| Jb Construction Inc | $114,848 | -- |
Source: Public Records
Mortgage History
| Date | Status | Borrower | Loan Amount |
|---|---|---|---|
| Open | Rivas Jose | $220,924 | |
| Previous Owner | Newandu Franklin | $386,750 |
Source: Public Records
Tax History Compared to Growth
Tax History
| Year | Tax Paid | Tax Assessment Tax Assessment Total Assessment is a certain percentage of the fair market value that is determined by local assessors to be the total taxable value of land and additions on the property. | Land | Improvement |
|---|---|---|---|---|
| 2025 | $8,966 | $240,500 | $21,800 | $218,700 |
| 2024 | $8,966 | $240,500 | $21,800 | $218,700 |
| 2023 | $8,985 | $240,500 | $21,800 | $218,700 |
| 2022 | $8,985 | $240,500 | $21,800 | $218,700 |
| 2021 | $8,980 | $240,500 | $21,800 | $218,700 |
| 2020 | $9,139 | $240,500 | $21,800 | $218,700 |
| 2019 | $9,045 | $240,500 | $21,800 | $218,700 |
| 2018 | $8,882 | $240,500 | $21,800 | $218,700 |
| 2017 | $8,562 | $240,500 | $21,800 | $218,700 |
| 2016 | $8,273 | $240,500 | $21,800 | $218,700 |
| 2015 | $7,958 | $240,500 | $21,800 | $218,700 |
| 2014 | $7,458 | $240,500 | $21,800 | $218,700 |
Source: Public Records
Map
Nearby Homes
- 76 4th St Unit 2
- 72 4th St Unit 74
- 80 4th St
- 70 4th St
- 74 4th St Unit 3
- 69 N 5th St
- 68 4th St
- 68 4th St
- 71 N 5th St Unit 1
- 71 N 5th St Unit 3
- 79 4th St Unit 1B
- 79 4th St Unit 3A
- 79 4th St Unit 1A
- 79 4th St
- 63 N 5th St
- 65 N 5th St Unit 67
- 328 Sussex Ave Unit 330
- 66 4th St
- 61 N 5th St
- 73 4th St Unit 3B