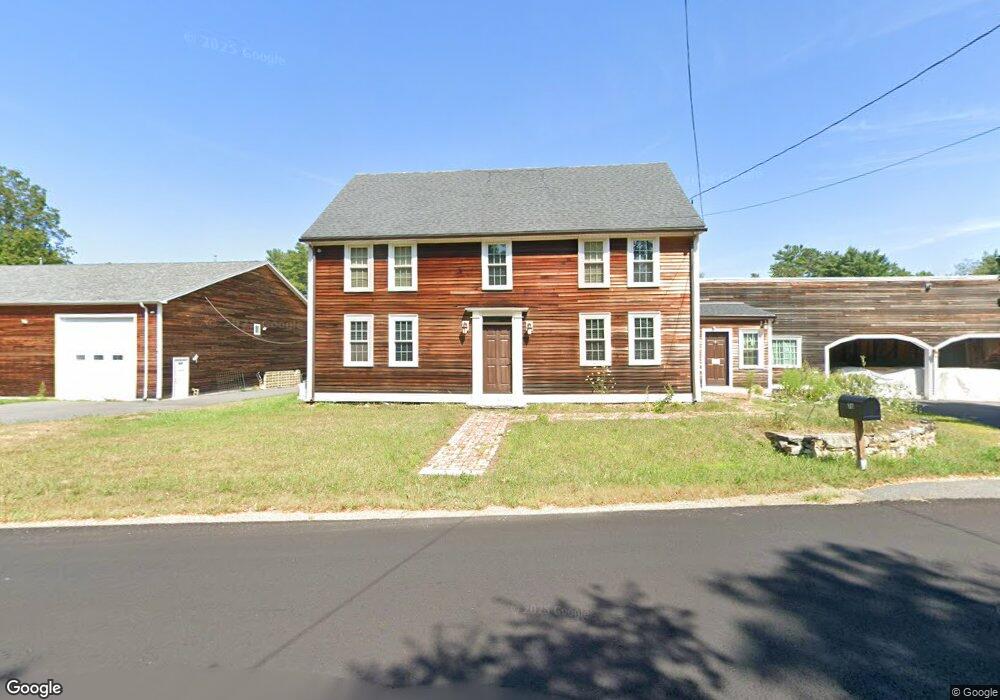
76 Elm St New Salem, MA 01355
New Salem NeighborhoodEstimated Value: $492,000 - $532,000
3
Beds
2
Baths
2,648
Sq Ft
$196/Sq Ft
Est. Value
About This Home
This home is located at 76 Elm St, New Salem, MA 01355 and is currently estimated at $518,878, approximately $195 per square foot. 76 Elm St is a home located in Franklin County with nearby schools including Swift River School and Ralph C Mahar Regional School.
Ownership History
Date
Name
Owned For
Owner Type
Purchase Details
Closed on
Feb 28, 2005
Sold by
Voutselas Theodore
Bought by
Mallet Dennis P and Mallet Alane P
Current Estimated Value
Home Financials for this Owner
Home Financials are based on the most recent Mortgage that was taken out on this home.
Original Mortgage
$50,000
Outstanding Balance
$25,550
Interest Rate
5.73%
Mortgage Type
Purchase Money Mortgage
Estimated Equity
$493,328
Create a Home Valuation Report for This Property
The Home Valuation Report is an in-depth analysis detailing your home's value as well as a comparison with similar homes in the area
Home Values in the Area
Average Home Value in this Area
Purchase History
| Date | Buyer | Sale Price | Title Company |
|---|---|---|---|
| Mallet Dennis P | $60,000 | -- |
Source: Public Records
Mortgage History
| Date | Status | Borrower | Loan Amount |
|---|---|---|---|
| Open | Mallet Dennis P | $50,000 |
Source: Public Records
Tax History Compared to Growth
Tax History
| Year | Tax Paid | Tax Assessment Tax Assessment Total Assessment is a certain percentage of the fair market value that is determined by local assessors to be the total taxable value of land and additions on the property. | Land | Improvement |
|---|---|---|---|---|
| 2025 | $6,721 | $494,900 | $52,800 | $442,100 |
| 2024 | $4,823 | $335,600 | $52,800 | $282,800 |
| 2023 | $5,090 | $331,600 | $54,200 | $277,400 |
| 2022 | $4,885 | $258,200 | $54,200 | $204,000 |
| 2021 | $4,760 | $242,500 | $49,700 | $192,800 |
| 2020 | $4,375 | $242,500 | $49,700 | $192,800 |
| 2019 | $229 | $242,500 | $49,700 | $192,800 |
| 2018 | $4,333 | $239,000 | $48,200 | $190,800 |
| 2017 | $4,165 | $232,300 | $46,000 | $186,300 |
| 2016 | $2,738 | $158,900 | $46,000 | $112,900 |
| 2015 | $2,596 | $157,500 | $49,100 | $108,400 |
Source: Public Records
Map
Nearby Homes