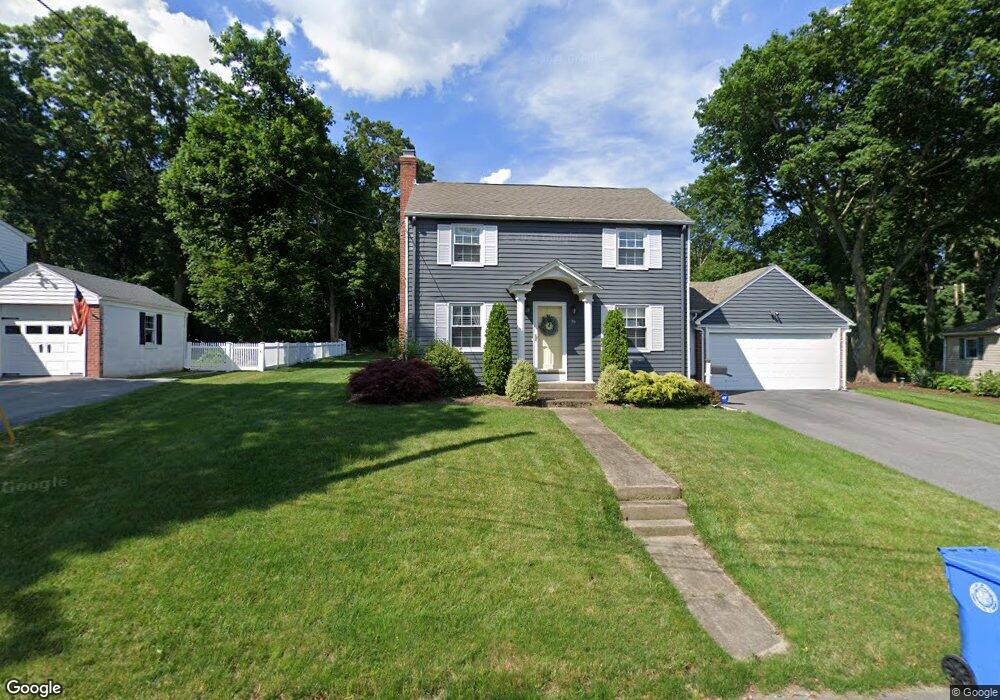
76 Hilltop Dr Cranston, RI 02920
Mayfield NeighborhoodEstimated Value: $549,000 - $733,000
3
Beds
2
Baths
1,710
Sq Ft
$365/Sq Ft
Est. Value
About This Home
This home is located at 76 Hilltop Dr, Cranston, RI 02920 and is currently estimated at $623,492, approximately $364 per square foot. 76 Hilltop Dr is a home located in Providence County with nearby schools including Garden City School, Western Hills Middle School, and Cranston High School West.
Ownership History
Date
Name
Owned For
Owner Type
Purchase Details
Closed on
Jul 8, 2013
Sold by
Raleigh Richard E and Raleigh Kristen M
Bought by
Casey Brandon R and Casey Kelsey N
Current Estimated Value
Home Financials for this Owner
Home Financials are based on the most recent Mortgage that was taken out on this home.
Original Mortgage
$222,888
Outstanding Balance
$159,254
Interest Rate
3.59%
Mortgage Type
New Conventional
Estimated Equity
$464,238
Purchase Details
Closed on
Apr 23, 1999
Sold by
Isman Stewart R and Isman Julie I
Bought by
Raleigh Richard E and Blanchard Kristen M
Home Financials for this Owner
Home Financials are based on the most recent Mortgage that was taken out on this home.
Original Mortgage
$121,324
Interest Rate
7.02%
Mortgage Type
Purchase Money Mortgage
Purchase Details
Closed on
Jun 6, 1994
Sold by
Hackett Phyllis E
Bought by
Isman Stewart R and Isman Julie
Create a Home Valuation Report for This Property
The Home Valuation Report is an in-depth analysis detailing your home's value as well as a comparison with similar homes in the area
Home Values in the Area
Average Home Value in this Area
Purchase History
| Date | Buyer | Sale Price | Title Company |
|---|---|---|---|
| Casey Brandon R | $227,000 | -- | |
| Raleigh Richard E | $125,000 | -- | |
| Isman Stewart R | $116,000 | -- |
Source: Public Records
Mortgage History
| Date | Status | Borrower | Loan Amount |
|---|---|---|---|
| Open | Isman Stewart R | $222,888 | |
| Previous Owner | Isman Stewart R | $135,000 | |
| Previous Owner | Isman Stewart R | $120,000 | |
| Previous Owner | Isman Stewart R | $121,324 |
Source: Public Records
Tax History
| Year | Tax Paid | Tax Assessment Tax Assessment Total Assessment is a certain percentage of the fair market value that is determined by local assessors to be the total taxable value of land and additions on the property. | Land | Improvement |
|---|---|---|---|---|
| 2025 | $6,274 | $452,000 | $139,000 | $313,000 |
| 2024 | $6,033 | $443,300 | $139,000 | $304,300 |
| 2023 | $5,899 | $312,100 | $91,400 | $220,700 |
| 2022 | $5,040 | $272,300 | $91,400 | $180,900 |
| 2021 | $4,901 | $272,300 | $91,400 | $180,900 |
| 2020 | $5,008 | $241,100 | $87,100 | $154,000 |
| 2019 | $5,008 | $241,100 | $87,100 | $154,000 |
| 2018 | $4,892 | $241,100 | $87,100 | $154,000 |
| 2017 | $4,762 | $207,600 | $78,400 | $129,200 |
| 2016 | $4,661 | $207,600 | $78,400 | $129,200 |
| 2015 | $4,661 | $207,600 | $78,400 | $129,200 |
| 2014 | $4,627 | $202,600 | $78,400 | $124,200 |
Source: Public Records
Map
Nearby Homes
- 20 Hilltop Dr
- 33 Rose Hill Dr
- 10 East St Unit 316
- 14 Amanda St
- 14 W Natick Rd
- 36 Bleachery Ct
- 1027 Providence St Unit 4B
- 50 Briarwood Rd
- 78 Wilbur Ave
- 20 Manilla Ave
- 87 Lincoln Park Ave
- 52 Cottonwood Dr
- 82 Mountain Laurel Dr
- 115 Edman St
- 123 Edman St
- 42 Woodland Dr
- 157 Sweetbriar Dr
- 12 Railroad Row
- 217 Belvedere Dr
- 993 Williamsburg Cir
Your Personal Tour Guide
Ask me questions while you tour the home.