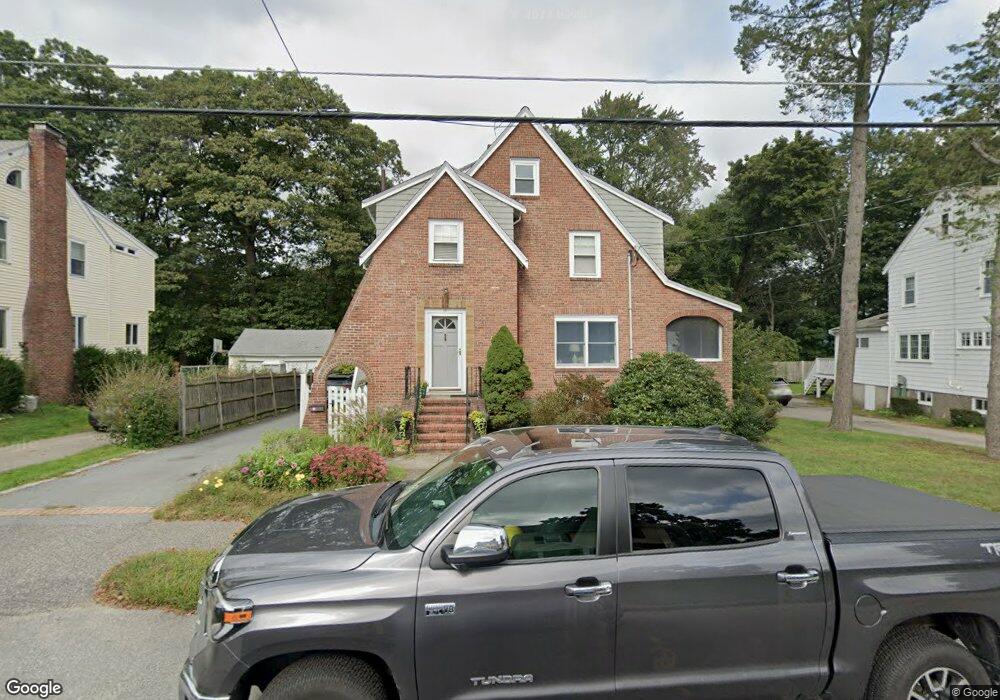
76 Lorimer Rd Belmont, MA 02478
Belmont Hill NeighborhoodEstimated Value: $1,269,000 - $1,788,000
4
Beds
3
Baths
2,424
Sq Ft
$644/Sq Ft
Est. Value
About This Home
This home is located at 76 Lorimer Rd, Belmont, MA 02478 and is currently estimated at $1,561,524, approximately $644 per square foot. 76 Lorimer Rd is a home located in Middlesex County with nearby schools including Roger Wellington Elementary School, Winthrop L Chenery Middle School, and Belmont High School.
Ownership History
Date
Name
Owned For
Owner Type
Purchase Details
Closed on
Mar 30, 1988
Sold by
Doyle Harold B
Bought by
Murphy James P
Current Estimated Value
Home Financials for this Owner
Home Financials are based on the most recent Mortgage that was taken out on this home.
Original Mortgage
$160,000
Interest Rate
9.89%
Mortgage Type
Purchase Money Mortgage
Create a Home Valuation Report for This Property
The Home Valuation Report is an in-depth analysis detailing your home's value as well as a comparison with similar homes in the area
Home Values in the Area
Average Home Value in this Area
Purchase History
| Date | Buyer | Sale Price | Title Company |
|---|---|---|---|
| Murphy James P | $218,000 | -- |
Source: Public Records
Mortgage History
| Date | Status | Borrower | Loan Amount |
|---|---|---|---|
| Open | Murphy James P | $240,000 | |
| Closed | Murphy James P | $185,000 | |
| Closed | Murphy James P | $15,000 | |
| Closed | Murphy James P | $160,000 |
Source: Public Records
Tax History
| Year | Tax Paid | Tax Assessment Tax Assessment Total Assessment is a certain percentage of the fair market value that is determined by local assessors to be the total taxable value of land and additions on the property. | Land | Improvement |
|---|---|---|---|---|
| 2025 | $16,834 | $1,478,000 | $744,000 | $734,000 |
| 2024 | $14,541 | $1,377,000 | $798,000 | $579,000 |
| 2023 | $14,353 | $1,277,000 | $753,000 | $524,000 |
| 2022 | $12,313 | $1,177,000 | $689,000 | $488,000 |
| 2021 | $12,708 | $1,067,000 | $660,000 | $407,000 |
| 2020 | $12,155 | $1,105,000 | $698,000 | $407,000 |
| 2019 | $3,379 | $922,000 | $541,000 | $381,000 |
| 2018 | $11,277 | $821,000 | $440,000 | $381,000 |
| 2017 | $3,141 | $737,000 | $356,000 | $381,000 |
| 2016 | $9,219 | $734,000 | $356,000 | $378,000 |
| 2015 | $8,669 | $672,000 | $296,000 | $376,000 |
Source: Public Records
Map
Nearby Homes
- 43 S Cottage Rd Unit 43
- 100 Shirley Rd
- 60 Agassiz Ave
- 135 Marsh St
- 546 Trapelo Rd
- 50 Moraine St
- 6 Grant Ave
- 15 Spring Valley Rd
- 53 Crestview Rd
- 16 Davis St Unit 16
- 14 Davis St Unit 16
- 14-16 Davis St
- 23 Centre Ave
- 43-43A Chandler St
- 34 Gill Rd Unit 4
- 156 Waverley St Unit 156
- 156 Waverley St Unit 158
- 9 Henry St Unit 9
- 121 White St
- 123 White St
Your Personal Tour Guide
Ask me questions while you tour the home.