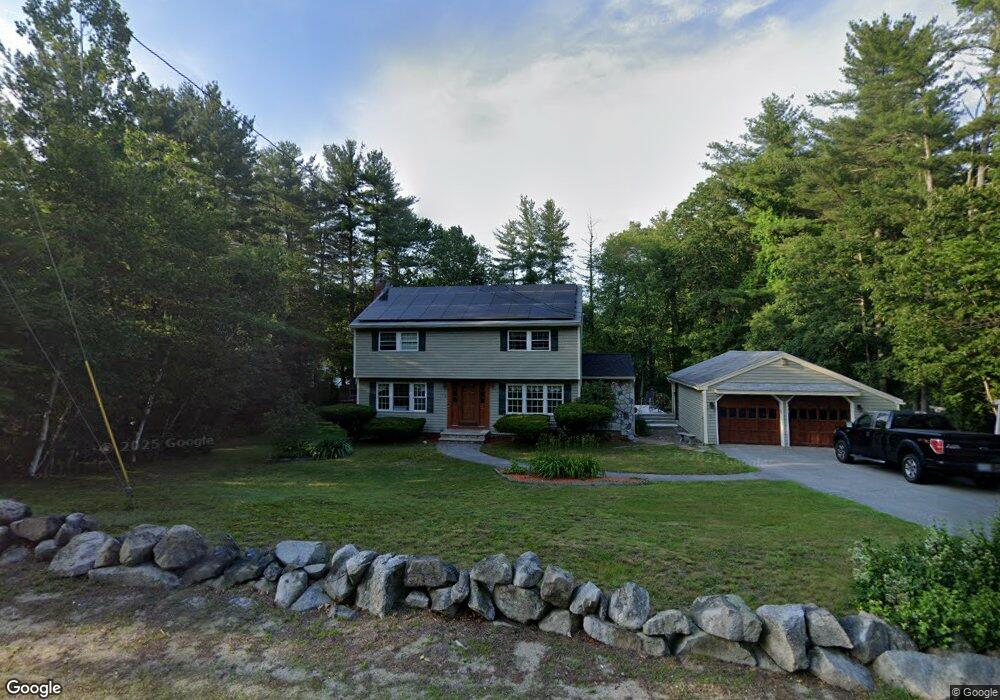
76 Nashua Rd Pelham, NH 03076
Estimated Value: $545,000 - $629,000
4
Beds
2
Baths
1,762
Sq Ft
$329/Sq Ft
Est. Value
About This Home
This home is located at 76 Nashua Rd, Pelham, NH 03076 and is currently estimated at $580,144, approximately $329 per square foot. 76 Nashua Rd is a home with nearby schools including Pelham Elementary School, Pelham Memorial School, and Pelham High School.
Ownership History
Date
Name
Owned For
Owner Type
Purchase Details
Closed on
Apr 15, 2022
Sold by
Arsenault Kenneth R and Arsenault Suzy M
Bought by
Arsenault
Current Estimated Value
Home Financials for this Owner
Home Financials are based on the most recent Mortgage that was taken out on this home.
Original Mortgage
$155,000
Interest Rate
3.15%
Mortgage Type
Stand Alone Refi Refinance Of Original Loan
Purchase Details
Closed on
Feb 23, 2022
Sold by
Arscnault
Bought by
Arsenault Kenneth R and Arsenault Suzy M
Home Financials for this Owner
Home Financials are based on the most recent Mortgage that was taken out on this home.
Original Mortgage
$155,000
Interest Rate
3.15%
Mortgage Type
Stand Alone Refi Refinance Of Original Loan
Create a Home Valuation Report for This Property
The Home Valuation Report is an in-depth analysis detailing your home's value as well as a comparison with similar homes in the area
Home Values in the Area
Average Home Value in this Area
Purchase History
| Date | Buyer | Sale Price | Title Company |
|---|---|---|---|
| Arsenault | -- | None Available | |
| Arsenault Kenneth R | -- | None Available | |
| Arsenault Kenneth R | -- | None Available |
Source: Public Records
Mortgage History
| Date | Status | Borrower | Loan Amount |
|---|---|---|---|
| Previous Owner | Arsenault Kenneth R | $155,000 |
Source: Public Records
Tax History Compared to Growth
Tax History
| Year | Tax Paid | Tax Assessment Tax Assessment Total Assessment is a certain percentage of the fair market value that is determined by local assessors to be the total taxable value of land and additions on the property. | Land | Improvement |
|---|---|---|---|---|
| 2024 | $7,169 | $390,900 | $150,300 | $240,600 |
| 2023 | $7,110 | $390,900 | $150,300 | $240,600 |
| 2022 | $6,809 | $390,900 | $150,300 | $240,600 |
| 2021 | $6,239 | $390,900 | $150,300 | $240,600 |
| 2020 | $5,755 | $284,900 | $120,200 | $164,700 |
| 2019 | $5,527 | $284,900 | $120,200 | $164,700 |
| 2018 | $5,526 | $257,500 | $114,100 | $143,400 |
| 2017 | $5,523 | $257,500 | $114,100 | $143,400 |
| 2016 | $5,395 | $257,500 | $114,100 | $143,400 |
| 2015 | $5,385 | $231,500 | $108,500 | $123,000 |
| 2014 | $5,290 | $231,300 | $108,500 | $122,800 |
| 2013 | $5,290 | $231,300 | $108,500 | $122,800 |
Source: Public Records
Map
Nearby Homes
- 1 Redwood Rd
- 96 Simpson Rd
- 4 Haystack Cir
- 1119 Mammoth Rd
- 508 Mammoth Rd
- 10 Oakland Ridge Rd Unit 11
- 11 Venus Way
- 7 Venus Way Unit 22
- 63 Marsh Rd
- 5 Stephanie Dr
- 446 Mammoth Rd
- 436 Mammoth Rd
- 45 Hobbs Rd
- 10 Dutton Rd
- 2 Cypress Ln
- 7 Cypress Ln Unit 5
- 24 Del Ray Dr Unit 25
- 24 Del Ray Dr
- 23 Ryan Farm Rd
- 1 Currier Rd