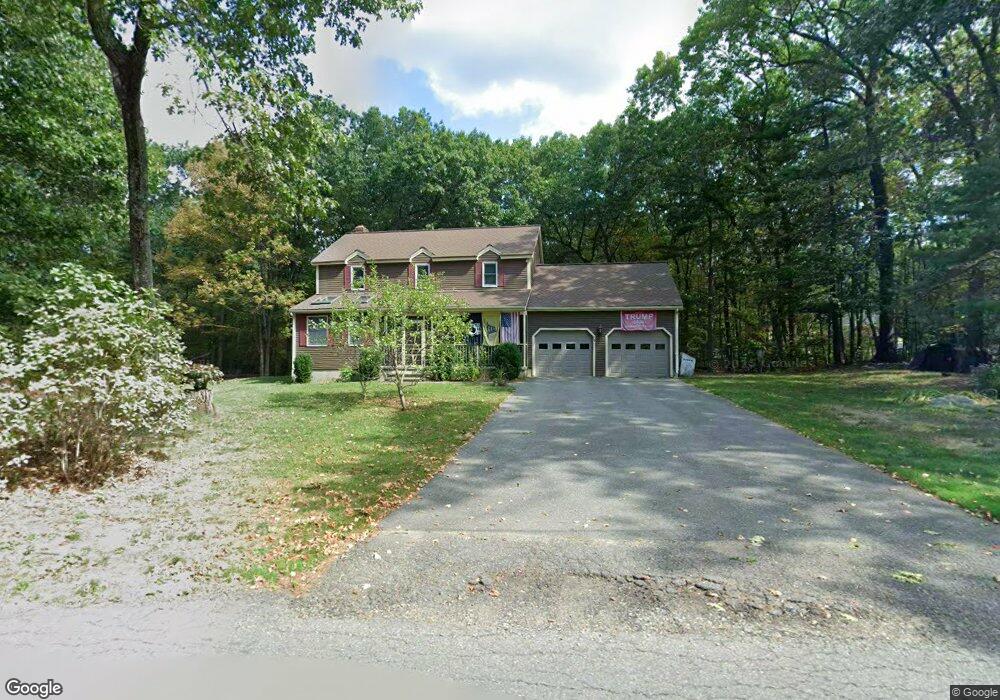
76 Tyler Rd Townsend, MA 01469
Estimated Value: $506,000 - $594,872
4
Beds
3
Baths
1,939
Sq Ft
$288/Sq Ft
Est. Value
About This Home
This home is located at 76 Tyler Rd, Townsend, MA 01469 and is currently estimated at $558,218, approximately $287 per square foot. 76 Tyler Rd is a home located in Middlesex County with nearby schools including North Middlesex Regional High School.
Ownership History
Date
Name
Owned For
Owner Type
Purchase Details
Closed on
Apr 11, 2011
Sold by
Mueller Michael H and Mueller Cordelia B
Bought by
Int Mueller and Mueller Michael H
Current Estimated Value
Home Financials for this Owner
Home Financials are based on the most recent Mortgage that was taken out on this home.
Original Mortgage
$130,000
Interest Rate
4.99%
Mortgage Type
Purchase Money Mortgage
Create a Home Valuation Report for This Property
The Home Valuation Report is an in-depth analysis detailing your home's value as well as a comparison with similar homes in the area
Home Values in the Area
Average Home Value in this Area
Purchase History
We collect this data history from publicly available records. To have your information removed, we recommend requesting removal directly through your county’s website.
| Date | Buyer | Sale Price | Title Company |
|---|---|---|---|
| Int Mueller | $239,815 | -- | |
| Mueller Michael H | -- | -- |
Source: Public Records
Mortgage History
We collect this data history from publicly available records. To have your information removed, we recommend requesting removal directly through your county’s website.
| Date | Status | Borrower | Loan Amount |
|---|---|---|---|
| Closed | Mueller Michael H | $130,000 |
Source: Public Records
Tax History
| Year | Tax Paid | Tax Assessment Tax Assessment Total Assessment is a certain percentage of the fair market value that is determined by local assessors to be the total taxable value of land and additions on the property. | Land | Improvement |
|---|---|---|---|---|
| 2025 | $6,996 | $481,800 | $112,300 | $369,500 |
| 2024 | $6,812 | $472,700 | $112,300 | $360,400 |
| 2023 | $6,832 | $447,700 | $99,300 | $348,400 |
| 2022 | $6,447 | $366,100 | $85,000 | $281,100 |
| 2021 | $6,364 | $347,200 | $85,900 | $261,300 |
| 2020 | $6,114 | $313,200 | $73,500 | $239,700 |
| 2019 | $6,017 | $311,300 | $73,500 | $237,800 |
| 2018 | $5,661 | $279,400 | $70,200 | $209,200 |
| 2017 | $5,248 | $266,800 | $71,400 | $195,400 |
| 2016 | $5,108 | $258,000 | $71,400 | $186,600 |
| 2015 | $4,992 | $261,200 | $78,400 | $182,800 |
| 2014 | $4,945 | $252,700 | $75,800 | $176,900 |
Source: Public Records
Map
Nearby Homes
- 184 Fitchburg Rd
- 21 Emery Rd
- 36 Gilchrest St
- 18 Wintergreen Ct Unit 18
- Lot C Chase Rd
- 32 Hemlock Dr
- 167 Townsend Harbor Rd
- 115 Oak Ave
- 1 Depot Street Extension Unit 4
- 1 Depot Street Extension Unit 1
- 1 Depot Street Extension Unit 5
- 319 Chase Rd
- 18 Hillside Dr
- 440 Howard St
- 142 Whiting St
- 21 Ferdinand Passwa
- 189 Electric Unit A
- 8 South St
- 846 Massachusetts Ave
- 41 Brookline St
Your Personal Tour Guide
Ask me questions while you tour the home.