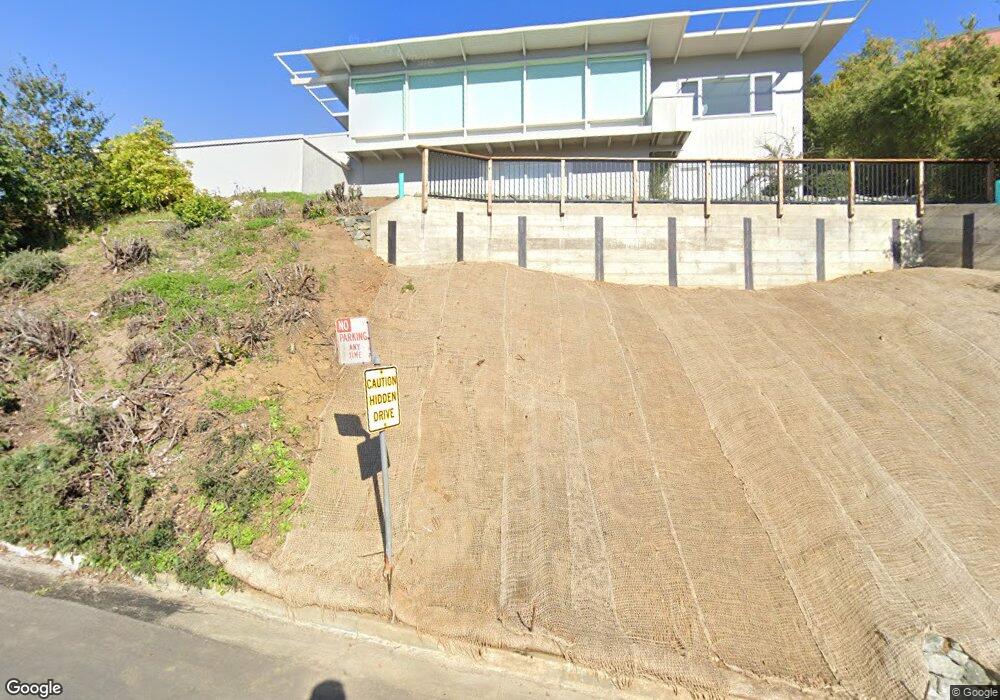
760 Alvarado Rd Berkeley, CA 94705
Claremont Hills NeighborhoodEstimated Value: $1,785,770 - $2,192,000
2
Beds
2
Baths
2,351
Sq Ft
$865/Sq Ft
Est. Value
About This Home
This home is located at 760 Alvarado Rd, Berkeley, CA 94705 and is currently estimated at $2,033,693, approximately $865 per square foot. 760 Alvarado Rd is a home located in Alameda County with nearby schools including Chabot Elementary School, Thornhill Elementary School, and Claremont Middle School.
Ownership History
Date
Name
Owned For
Owner Type
Purchase Details
Closed on
Apr 23, 2007
Sold by
Roemer Beth
Bought by
Roemer Beth and Beth Roemer Living Trust
Current Estimated Value
Purchase Details
Closed on
Jul 13, 2006
Sold by
Latimer Mark and Mary H Sullivan Living Trust
Bought by
Roemer Beth
Purchase Details
Closed on
Jul 11, 2006
Sold by
Lewis Daniel
Bought by
Roemer Beth
Purchase Details
Closed on
Sep 26, 1994
Sold by
Sullivan Mary H
Bought by
Sullivan Mary H and The Mary H Sullivan Living Tru
Create a Home Valuation Report for This Property
The Home Valuation Report is an in-depth analysis detailing your home's value as well as a comparison with similar homes in the area
Home Values in the Area
Average Home Value in this Area
Purchase History
| Date | Buyer | Sale Price | Title Company |
|---|---|---|---|
| Roemer Beth | -- | None Available | |
| Roemer Beth | $1,550,000 | First American Title Co | |
| Roemer Beth | -- | First American Title Co | |
| Sullivan Mary H | -- | -- |
Source: Public Records
Tax History
| Year | Tax Paid | Tax Assessment Tax Assessment Total Assessment is a certain percentage of the fair market value that is determined by local assessors to be the total taxable value of land and additions on the property. | Land | Improvement |
|---|---|---|---|---|
| 2025 | $10,417 | $662,240 | $380,792 | $288,448 |
| 2024 | $10,417 | $649,120 | $373,327 | $282,793 |
| 2023 | $10,886 | $643,259 | $366,009 | $277,250 |
| 2022 | $10,690 | $623,647 | $358,833 | $271,814 |
| 2021 | $10,328 | $611,285 | $351,799 | $266,486 |
| 2020 | $10,207 | $611,948 | $348,193 | $263,755 |
| 2019 | $9,834 | $599,954 | $341,369 | $258,585 |
| 2018 | $9,627 | $588,195 | $334,678 | $253,517 |
| 2017 | $9,257 | $576,666 | $328,118 | $248,548 |
| 2016 | $8,962 | $565,362 | $321,686 | $243,676 |
| 2015 | $8,904 | $556,874 | $316,857 | $240,017 |
| 2014 | $8,787 | $545,967 | $310,651 | $235,316 |
Source: Public Records
Map
Nearby Homes
- 2 Gravatt Dr
- 0 Gravatt Dr Unit 41122154
- 641 Alvarado Rd
- 142 Gravatt Dr
- 260 Alvarado Rd
- 190 Stonewall Rd
- 1488 Alvarado Rd
- 150 Vicente Rd
- 7723 Claremont Ave
- 29 Live Oak Rd
- 0 Dartmouth Dr
- 1215 Alvarado Rd
- 1102 Grand View Dr
- 0 Tunnel Rd
- 1426 Grand View Dr
- 1375 Alvarado Rd
- 1383 Alvarado Rd
- 204 El Camino Real
- 0 Gypsy Ln
- 3382 Dwight Way
- 770 Alvarado Rd
- 8 Gravatt Dr
- 780 Alvarado Rd
- 745 Alvarado Rd
- 763 Alvarado Rd
- 769 Alvarado Rd
- 733 Alvarado Rd
- 16 Gravatt Dr
- 775 Alvarado Rd
- 757 Alvarado Rd
- 751 Alvarado Rd
- 790 Alvarado Rd
- 16 Slater Ln
- 781 Alvarado Rd
- 22 Gravatt Dr Unit SI FL2-ID1259146P
- 22 Gravatt Dr Unit FL2-ID1259146P
- 22 Gravatt Dr Unit ID1259146P
- 22 Gravatt Dr
- 789 Alvarado Rd
- 26 Slater Ln
Your Personal Tour Guide
Ask me questions while you tour the home.