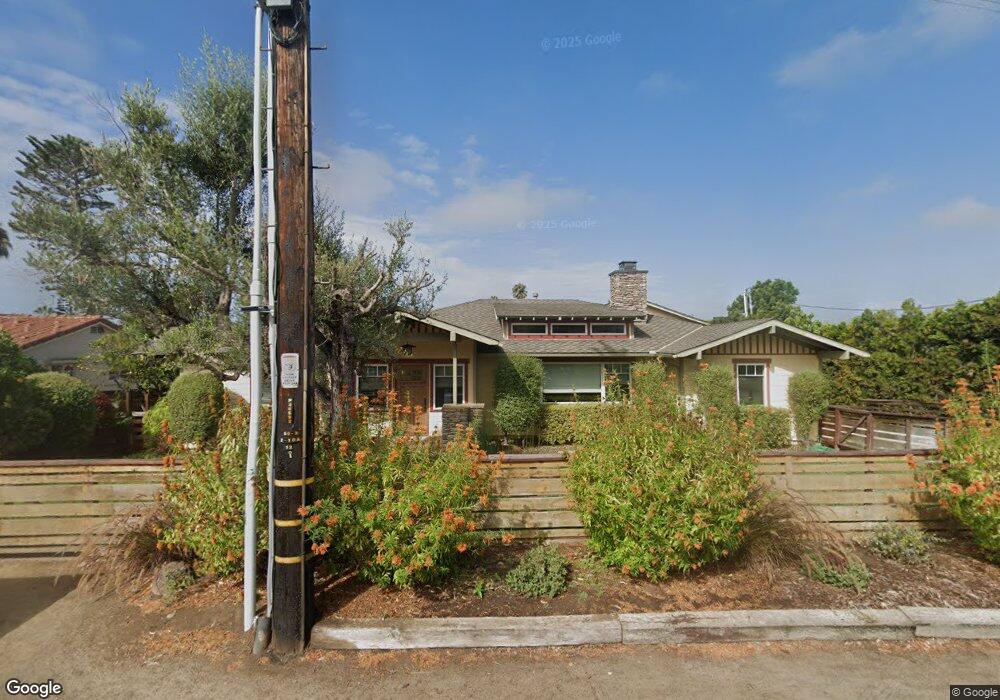
760 Nardo Rd Encinitas, CA 92024
Central Encinitas NeighborhoodEstimated Value: $1,413,000 - $3,111,000
7
Beds
6
Baths
3,264
Sq Ft
$606/Sq Ft
Est. Value
About This Home
This home is located at 760 Nardo Rd, Encinitas, CA 92024 and is currently estimated at $1,977,228, approximately $605 per square foot. 760 Nardo Rd is a home located in San Diego County with nearby schools including Ocean Knoll Elementary School, Oak Crest Middle School, and La Costa Canyon High School.
Ownership History
Date
Name
Owned For
Owner Type
Purchase Details
Closed on
Mar 30, 2007
Sold by
Tyler Tavin M and Tyler Joanne S
Bought by
Tyler Tavin M and Tyler Joanne S
Current Estimated Value
Purchase Details
Closed on
Apr 6, 1999
Sold by
Graham Family Trust 07-20-87 and Margaret L
Bought by
Tyler Tavin M and Tyler Joanne S
Home Financials for this Owner
Home Financials are based on the most recent Mortgage that was taken out on this home.
Original Mortgage
$300,000
Interest Rate
7.2%
Create a Home Valuation Report for This Property
The Home Valuation Report is an in-depth analysis detailing your home's value as well as a comparison with similar homes in the area
Home Values in the Area
Average Home Value in this Area
Purchase History
| Date | Buyer | Sale Price | Title Company |
|---|---|---|---|
| Tyler Tavin M | -- | None Available | |
| Tyler Tavin M | $375,000 | South Coast Title Company |
Source: Public Records
Mortgage History
| Date | Status | Borrower | Loan Amount |
|---|---|---|---|
| Previous Owner | Tyler Tavin M | $300,000 | |
| Closed | Tyler Tavin M | $37,500 |
Source: Public Records
Tax History
| Year | Tax Paid | Tax Assessment Tax Assessment Total Assessment is a certain percentage of the fair market value that is determined by local assessors to be the total taxable value of land and additions on the property. | Land | Improvement |
|---|---|---|---|---|
| 2025 | $13,748 | $1,158,414 | $174,764 | $983,650 |
| 2024 | $13,171 | $1,135,701 | $171,338 | $964,363 |
| 2023 | $10,366 | $878,139 | $163,077 | $715,062 |
| 2022 | $9,995 | $860,922 | $159,880 | $701,042 |
| 2021 | $10,108 | $844,043 | $156,746 | $687,297 |
| 2020 | $10,095 | $835,389 | $155,139 | $680,250 |
| 2019 | $9,910 | $819,010 | $152,098 | $666,912 |
| 2018 | $9,700 | $802,952 | $149,116 | $653,836 |
| 2017 | $9,496 | $787,209 | $146,193 | $641,016 |
| 2016 | $9,118 | $771,775 | $143,327 | $628,448 |
| 2015 | $8,902 | $760,184 | $141,175 | $619,009 |
| 2014 | $8,658 | $745,294 | $138,410 | $606,884 |
Source: Public Records
Map
Nearby Homes
- 664 Sea Ridge Ct
- 1009 Arcadia Rd
- 760 Bonita Dr
- 407 Requeza St Unit E9
- 935 Encinitas Blvd
- 545 Quail Pointe Ln
- 548 Quail Pointe Ln
- 800 Encinitas Blvd Unit 104
- 731 Teaberry St Unit 4
- 823 Stratford Dr
- 1010 Scarlet Way
- 1011 Monterey Vista Way
- 155 Rosebay Dr Unit 42
- 554 & 556 Stratford Dr
- 1025 Monterey Vista Way
- 1180 Devonshire Dr
- 1428 Mackinnon Ave
- 103 Mangano Cir
- 917 Santo Way
- 262 Coneflower St
- 802 Nardo Rd
- 740 Nardo Rd
- 814 Nardo Rd
- 744 Nardo Rd Unit A
- 722 Nardo Rd
- 820 Nardo Rd
- 824 Nardo Rd
- 759 Nardo Rd
- 1150 E Cove Place
- 1142 E Cove Place
- 1201 E Cove Place
- 1211 E Cove Place
- 1200 E Cove Place
- 1204 E Cove Place
- 1156 E Cove Place
- 1212 E Cove Place
- 1208 E Cove Place
- 1221 E Cove Place
- 1216 E Cove Place
- 739 Nardo Rd Unit 41
Your Personal Tour Guide
Ask me questions while you tour the home.