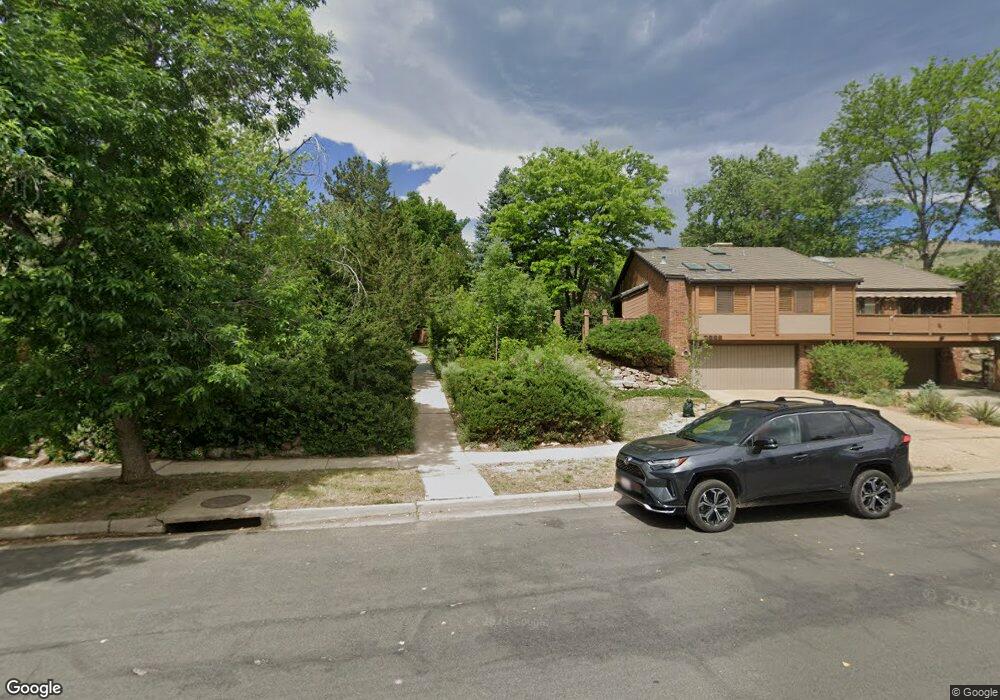
760 Poplar Ave Boulder, CO 80304
Wonderland NeighborhoodEstimated Value: $700,499 - $1,016,000
2
Beds
1
Bath
1,200
Sq Ft
$725/Sq Ft
Est. Value
About This Home
This home is located at 760 Poplar Ave, Boulder, CO 80304 and is currently estimated at $870,375, approximately $725 per square foot. 760 Poplar Ave is a home located in Boulder County with nearby schools including Foothill Elementary School, Centennial Middle School, and Boulder High School.
Ownership History
Date
Name
Owned For
Owner Type
Purchase Details
Closed on
Jan 12, 1994
Sold by
Clarke Steven K and Mccoy Susan B
Bought by
Clarke Steven K
Current Estimated Value
Home Financials for this Owner
Home Financials are based on the most recent Mortgage that was taken out on this home.
Original Mortgage
$124,850
Interest Rate
7.09%
Purchase Details
Closed on
Apr 5, 1988
Bought by
Clarke Steven K and Clarke Susan B
Purchase Details
Closed on
Nov 5, 1985
Bought by
Clarke Steven K and Clarke Susan B
Purchase Details
Closed on
Mar 17, 1978
Bought by
Clarke Steven K and Clarke Susan B
Create a Home Valuation Report for This Property
The Home Valuation Report is an in-depth analysis detailing your home's value as well as a comparison with similar homes in the area
Home Values in the Area
Average Home Value in this Area
Purchase History
| Date | Buyer | Sale Price | Title Company |
|---|---|---|---|
| Clarke Steven K | -- | Land Title | |
| Clarke Steven K | $122,500 | -- | |
| Clarke Steven K | $129,000 | -- | |
| Clarke Steven K | $75,500 | -- |
Source: Public Records
Mortgage History
| Date | Status | Borrower | Loan Amount |
|---|---|---|---|
| Closed | Clarke Steven K | $124,850 |
Source: Public Records
Tax History
| Year | Tax Paid | Tax Assessment Tax Assessment Total Assessment is a certain percentage of the fair market value that is determined by local assessors to be the total taxable value of land and additions on the property. | Land | Improvement |
|---|---|---|---|---|
| 2025 | $4,700 | $59,794 | $43,313 | $16,481 |
| 2024 | $4,700 | $59,794 | $43,313 | $16,481 |
| 2023 | $4,618 | $60,179 | $46,846 | $17,018 |
| 2022 | $4,207 | $52,250 | $37,766 | $14,484 |
| 2021 | $4,011 | $53,754 | $38,853 | $14,901 |
| 2020 | $3,787 | $50,651 | $28,457 | $22,194 |
| 2019 | $3,729 | $50,651 | $28,457 | $22,194 |
| 2018 | $3,227 | $44,424 | $18,648 | $25,776 |
| 2017 | $3,731 | $49,113 | $20,616 | $28,497 |
| 2016 | $3,192 | $36,878 | $24,994 | $11,884 |
| 2015 | $3,023 | $30,391 | $10,268 | $20,123 |
| 2014 | $2,555 | $30,391 | $10,268 | $20,123 |
Source: Public Records
Map
Nearby Homes
- 630 Northstar Ct
- 670 Quince Cir
- 1110 Poplar Ave
- 1180 Oakdale Place
- 805 Linden Ave
- 1095 Redwood Ave
- 3776 Orange Ln
- 3945 Promontory Ct
- 1245 Norwood Ave Unit 42
- 3850 Broadway St Unit 24
- 4893 Broadway
- 701 Kalmia Ave
- 503 Kalmia Ave
- 1205 Meadow Ave
- 700 Utica Ave
- 1285 Meadow Place
- 497 Kalmia Ave
- 855 Kalmia Ave
- 1205 Sumac Ave
- 913 Utica Ave
- 780 Poplar Ave
- 740 Poplar Ave
- 790 Poplar Ave
- 720 Poplar Ave
- 700 Poplar Ave
- 3965 Wonderland Hill Ave
- 3963 Wonderland Hill Ave
- 3969 Wonderland Hill Ave
- 690 Poplar Ave
- 680 Poplar Ave
- 680 Poplar Ave
- 3937 Orchard Ct
- 3935 Orchard Ct
- 676 Poplar Ave
- 678 Poplar Ave
- 674 Poplar Ave
- 757 Poplar Ave Unit 3
- 757 Poplar Ave
- 670 Poplar Ave
- 668 Poplar Ave
Your Personal Tour Guide
Ask me questions while you tour the home.