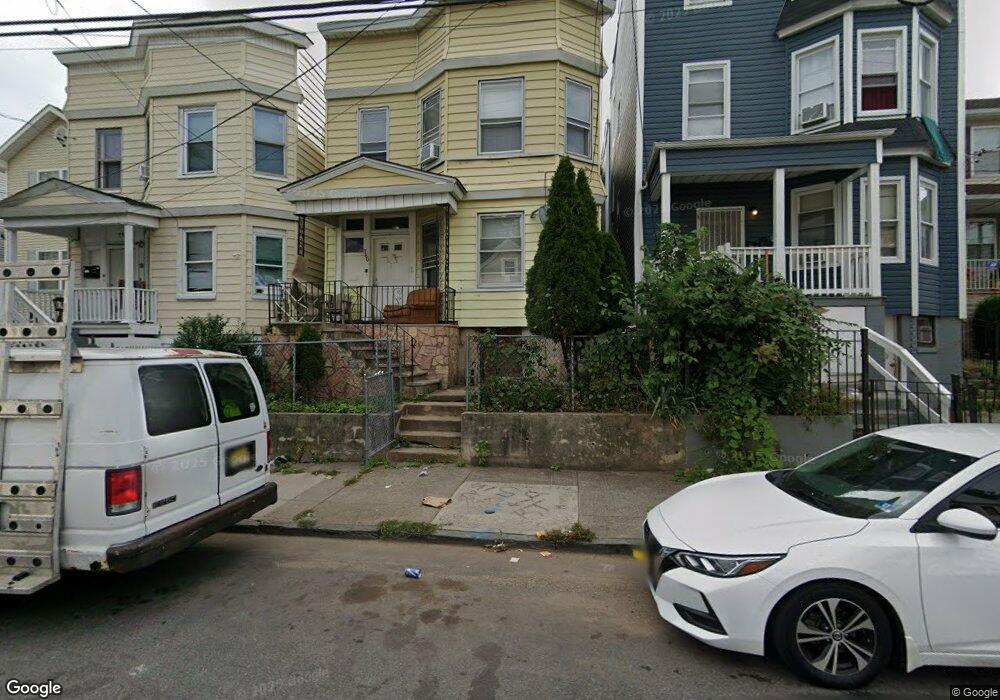
760 S 20th St Unit 2 Newark, NJ 07103
West Side NeighborhoodEstimated Value: $555,000 - $718,000
6
Beds
2
Baths
2,498
Sq Ft
$251/Sq Ft
Est. Value
About This Home
This home is located at 760 S 20th St Unit 2, Newark, NJ 07103 and is currently estimated at $625,966, approximately $250 per square foot. 760 S 20th St Unit 2 is a home located in Essex County with nearby schools including Hawthorne Avenue Elementary School, Lincoln Elementary School, and Louise A. Spencer School.
Ownership History
Date
Name
Owned For
Owner Type
Purchase Details
Closed on
Nov 23, 2021
Sold by
Key Strategies Llc
Bought by
Gold Moses
Current Estimated Value
Home Financials for this Owner
Home Financials are based on the most recent Mortgage that was taken out on this home.
Original Mortgage
$258,800
Outstanding Balance
$237,473
Interest Rate
3.09%
Mortgage Type
New Conventional
Estimated Equity
$388,493
Purchase Details
Closed on
Sep 13, 2021
Sold by
Payne Alexander
Bought by
Key Strategies Llc
Home Financials for this Owner
Home Financials are based on the most recent Mortgage that was taken out on this home.
Original Mortgage
$297,000
Interest Rate
2.8%
Mortgage Type
New Conventional
Purchase Details
Closed on
Aug 28, 2020
Sold by
Josephs Raynard and Josephs Leslie W
Bought by
Payne Alexander
Purchase Details
Closed on
Mar 11, 1991
Sold by
Bell Frederick and Bell Laura
Bought by
Josephs Leslie and Josephs Lydia
Create a Home Valuation Report for This Property
The Home Valuation Report is an in-depth analysis detailing your home's value as well as a comparison with similar homes in the area
Home Values in the Area
Average Home Value in this Area
Purchase History
| Date | Buyer | Sale Price | Title Company |
|---|---|---|---|
| Gold Moses | $323,500 | Madison Title Agency Llc | |
| Key Strategies Llc | -- | Boston National Title Agency | |
| Payne Alexander | $150,000 | Professional Abstract & Ttl | |
| Josephs Leslie | $84,000 | -- | |
| Josephs Leslie | $84,000 | -- |
Source: Public Records
Mortgage History
| Date | Status | Borrower | Loan Amount |
|---|---|---|---|
| Open | Gold Moses | $258,800 | |
| Previous Owner | Key Strategies Llc | $297,000 |
Source: Public Records
Tax History Compared to Growth
Tax History
| Year | Tax Paid | Tax Assessment Tax Assessment Total Assessment is a certain percentage of the fair market value that is determined by local assessors to be the total taxable value of land and additions on the property. | Land | Improvement |
|---|---|---|---|---|
| 2025 | $8,586 | $230,300 | $31,300 | $199,000 |
| 2024 | $8,586 | $230,300 | $31,300 | $199,000 |
| 2023 | $5,066 | $230,300 | $31,300 | $199,000 |
| 2022 | $5,066 | $135,600 | $31,300 | $104,300 |
| 2021 | $5,063 | $135,600 | $31,300 | $104,300 |
| 2020 | $5,153 | $135,600 | $31,300 | $104,300 |
| 2019 | $5,100 | $135,600 | $31,300 | $104,300 |
| 2018 | $5,008 | $135,600 | $31,300 | $104,300 |
| 2017 | $4,827 | $135,600 | $31,300 | $104,300 |
| 2016 | $4,665 | $135,600 | $31,300 | $104,300 |
| 2015 | $4,487 | $135,600 | $31,300 | $104,300 |
| 2014 | $4,205 | $135,600 | $31,300 | $104,300 |
Source: Public Records
Map
Nearby Homes
- 760 S 20th St
- 758 S 20th St Unit 2
- 762 S 20th St
- 756 S 20th St
- 764 S 20th St
- 766 S 20th St
- 754 S 20th St
- 754 S 20th St Unit 2
- 752 S 20th St
- 759 S 19th St Unit 761
- 757 S 19th St
- 768 S 20th St
- 750 S 20th St
- 753 S 19th St Unit 755
- 746 S 20th St Unit 748
- 772 S 20th St
- 759 S 20th St
- 757 S 20th St
- 761 S 20th St
- 763 S 20th St