
Seller's Agent in 2025
Brad Williams
RE/MAX
(303) 994-6625
1 in this area
44 Total Sales
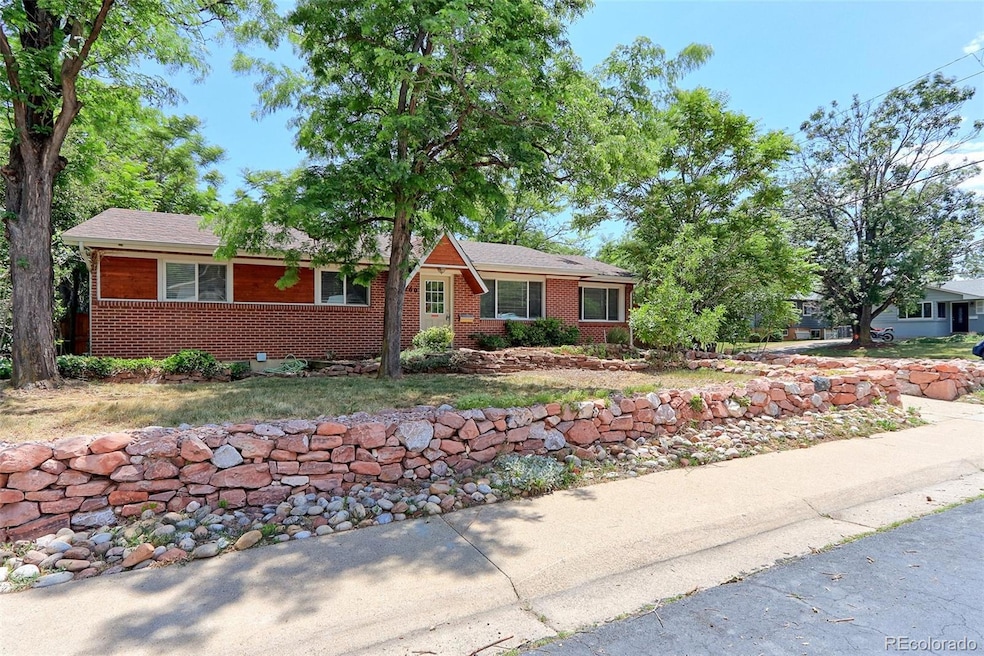


Welcome to this beautifully updated ranch style home located on a sunny corner lot in sought-after South Boulder. Boasting 3 bedrooms and 2 full bathrooms on the main level, this home features an open floor plan with vaulted ceilings, making it perfect for both relaxing and entertaining. Enjoy fresh interior paint and newly refinished hardwood floors throughout the main living spaces.
The spacious kitchen is a true highlight with a large center island, sleek granite countertops, stainless steel appliances, and plenty of storage. Natural light fills the home, and front-facing windows offer stunning views of the Flatirons.
The partially finished basement adds extra versatility, complete with a laundry area, half bathroom, and a flex space with concrete floors — ready for your personal touch as a home office, gym, or creative studio.
Outside, you’ll find a detached 2-car garage, a gated driveway, and a low-maintenance yard. Just two blocks from Whole Foods and within easy walking or biking distance to local restaurants, parks, trails, and top-rated schools, this home offers the best of Boulder living in a prime location.
Don't miss this opportunity to own a stylish home with a lot of updates but still leaves room for your design in one of Boulder’s most desirable neighborhoods!
Last Agent to Sell the Property
RE/MAX Northwest Inc Brokerage Email: BRADWITHREMAX@MSN.COM,303-994-6625 License #100014372 Listed on: 06/27/2025
| Date | Type | Sale Price | Title Company |
|---|---|---|---|
| Special Warranty Deed | $900,000 | Land Title | |
| Quit Claim Deed | -- | Land Title Guarantee | |
| Warranty Deed | $451,221 | None Available | |
| Interfamily Deed Transfer | -- | None Available | |
| Warranty Deed | $451,000 | None Available | |
| Corporate Deed | $339,000 | Chicago Title Co | |
| Warranty Deed | $339,000 | Chicago Title Co | |
| Deed | $127,500 | -- | |
| Warranty Deed | $21,500 | -- |
| Date | Status | Loan Amount | Loan Type |
|---|---|---|---|
| Open | $765,000 | New Conventional | |
| Previous Owner | $57,800 | Stand Alone Second | |
| Previous Owner | $271,200 | Fannie Mae Freddie Mac |
| Date | Event | Price | List to Sale | Price per Sq Ft |
|---|---|---|---|---|
| 09/03/2025 09/03/25 | Sold | $900,000 | -5.3% | $504 / Sq Ft |
| 07/24/2025 07/24/25 | Price Changed | $950,000 | -2.6% | $533 / Sq Ft |
| 07/10/2025 07/10/25 | Price Changed | $975,000 | -2.5% | $547 / Sq Ft |
| 06/27/2025 06/27/25 | For Sale | $1,000,000 | -- | $561 / Sq Ft |
| Year | Tax Paid | Tax Assessment Tax Assessment Total Assessment is a certain percentage of the fair market value that is determined by local assessors to be the total taxable value of land and additions on the property. | Land | Improvement |
|---|---|---|---|---|
| 2025 | $6,031 | $63,656 | $30,506 | $33,150 |
| 2024 | $6,031 | $63,656 | $30,506 | $33,150 |
| 2023 | $5,926 | $68,621 | $36,053 | $36,254 |
| 2022 | $5,109 | $55,016 | $26,841 | $28,175 |
| 2021 | $4,872 | $56,599 | $27,613 | $28,986 |
| 2020 | $4,693 | $53,912 | $26,098 | $27,814 |
| 2019 | $4,621 | $53,912 | $26,098 | $27,814 |
| 2018 | $4,172 | $48,118 | $24,048 | $24,070 |
| 2017 | $4,041 | $53,196 | $26,586 | $26,610 |
| 2016 | $3,771 | $43,557 | $17,432 | $26,125 |
| 2015 | $3,570 | $35,963 | $14,328 | $21,635 |
| 2014 | $3,024 | $35,963 | $14,328 | $21,635 |
Seller's Agent in 2025
Brad Williams
RE/MAX
(303) 994-6625
1 in this area
44 Total Sales
Buyer's Agent in 2025
Ethan Bullock
Compass - Boulder
(303) 487-5472
3 in this area
170 Total Sales
Buyer Co-Listing Agent in 2025
Zachary Zeldner
Compass Colorado, LLC - Boulder
(720) 480-7650
7 in this area
259 Total Sales
Source: REcolorado®
MLS Number: 7808122
APN: 1577081-05-018
Disclaimer: Certain information contained herein is derived from information provided by parties other than Homes.com. All information provided is deemed reliable, but is not guaranteed to be accurate and should be independently verified.
![]() Based on information submitted to the MLS GRID. All data is obtained from various sources and may not have been verified by broker or MLS GRID. Supplied Open House Information is subject to change without notice. All information should be independently reviewed and verified for accuracy. Properties may or may not be listed by the office/agent presenting the information. Some IDX listings have been excluded from this website. The content relating to real estate for sale in this Web site comes in part from the Internet Data eXchange (“IDX”) program of METROLIST, INC., DBA RECOLORADO®. Real estate listings held by brokers other than Ten-X are marked with the IDX Logo. This information is being provided for the consumers’ personal, non-commercial use and may not be used for any other purpose. All information is subject to change and should be independently verified.
Based on information submitted to the MLS GRID. All data is obtained from various sources and may not have been verified by broker or MLS GRID. Supplied Open House Information is subject to change without notice. All information should be independently reviewed and verified for accuracy. Properties may or may not be listed by the office/agent presenting the information. Some IDX listings have been excluded from this website. The content relating to real estate for sale in this Web site comes in part from the Internet Data eXchange (“IDX”) program of METROLIST, INC., DBA RECOLORADO®. Real estate listings held by brokers other than Ten-X are marked with the IDX Logo. This information is being provided for the consumers’ personal, non-commercial use and may not be used for any other purpose. All information is subject to change and should be independently verified.
This publication is designed to provide information with regard to the subject matter covered. It is displayed with the understanding that the publisher and authors are not engaged in rendering real estate, legal, accounting, tax, or other professional services and that the publisher and authors are not offering such advice in this publication. If real estate, legal, or other expert assistance is required, the services of a competent, professional person should be sought.
The information contained in this publication is subject to change without notice. METROLIST, INC., DBA RECOLORADO MAKES NO WARRANTY OF ANY KIND WITH REGARD TO THIS MATERIAL, INCLUDING, BUT NOT LIMITED TO, THE IMPLIED WARRANTIES OF MERCHANTABILITY AND FITNESS FOR A PARTICULAR PURPOSE. METROLIST, INC., DBA RECOLORADO SHALL NOT BE LIABLE FOR ERRORS CONTAINED HEREIN OR FOR ANY DAMAGES IN CONNECTION WITH THE FURNISHING, PERFORMANCE, OR USE OF THIS MATERIAL.
PUBLISHER’S NOTICE: All real estate advertised herein is subject to the Federal Fair Housing Act and the Colorado Fair Housing Act, which Acts make it illegal to make or publish any advertisement that indicates any preference, limitation, or discrimination based on race, color, religion, sex, handicap, familial status, or national origin.
METROLIST, INC., DBA RECOLORADO will not knowingly accept any advertising for real estate that is in violation of the law. All persons are hereby informed that all dwellings advertised are available on an equal opportunity basis.
© 2026 METROLIST, INC., DBA RECOLORADO® – All Rights Reserved. 6455 S. Yosemite St., Suite 500 Greenwood Village, CO 80111 USA
ALL RIGHTS RESERVED WORLDWIDE. No part of this publication may be reproduced, adapted, translated, stored in a retrieval system or transmitted in any form or by any means, electronic, mechanical, photocopying, recording, or otherwise, without the prior written permission of the publisher. The information contained herein including but not limited to all text, photographs, digital images, virtual tours, may be seeded and monitored for protection and tracking.
Based on information submitted to the MLS GRID
Ask me questions while you tour the home.