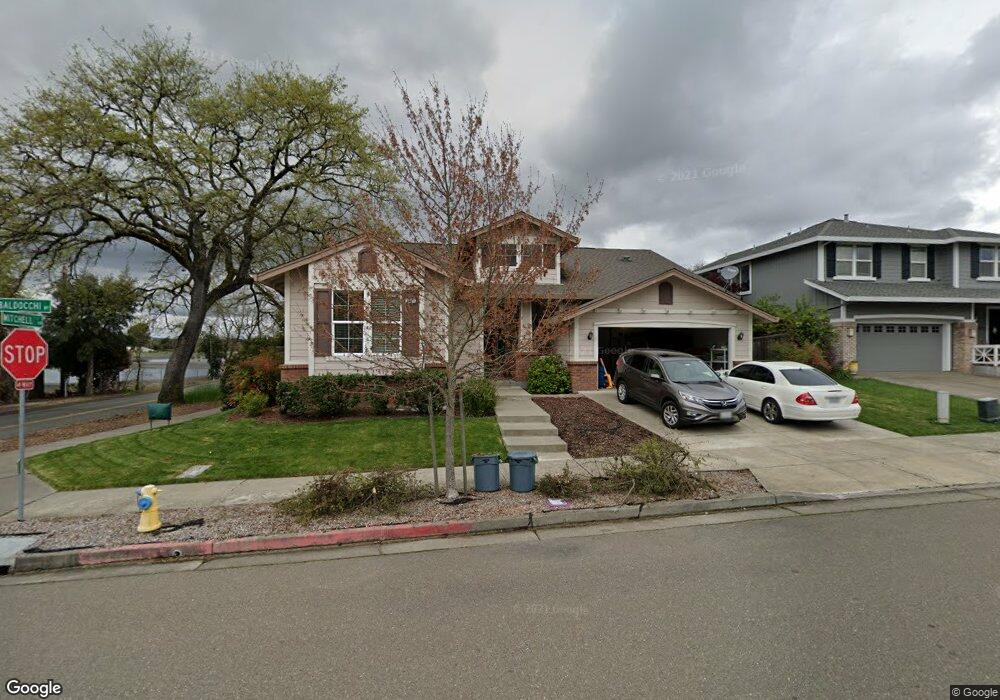
7601 Baldocchi Way Windsor, CA 95492
Estimated Value: $886,000 - $938,000
About This Home
This home is located at 7601 Baldocchi Way, Windsor, CA 95492 and is currently estimated at $919,175, approximately $427 per square foot. 7601 Baldocchi Way is a home located in Sonoma County with nearby schools including Mattie Washburn Elementary School, Brooks Elementary School, and Windsor Middle School.
Ownership History
We collect this data history from publicly available records. To have your information removed, we recommend requesting removal directly through your county’s website.
Purchase Details
Purchase Details
Home Financials for this Owner
Home Financials are based on the most recent Mortgage that was taken out on this home.Purchase Details
Home Financials for this Owner
Home Financials are based on the most recent Mortgage that was taken out on this home.Home Values in the Area
Average Home Value in this Area
Purchase History
We collect this data history from publicly available records. To have your information removed, we recommend requesting removal directly through your county’s website.
| Date | Buyer | Sale Price | Title Company |
|---|---|---|---|
| -- | None Available | ||
| $505,000 | Cornerstone Title Company | ||
| -- | North Bay Title Company |
Mortgage History
We collect this data history from publicly available records. To have your information removed, we recommend requesting removal directly through your county’s website.
| Date | Status | Borrower | Loan Amount |
|---|---|---|---|
| Open | $404,000 | ||
| Previous Owner | $322,700 |
Tax History
We collect this data history from publicly available records. To have your information removed, we recommend requesting removal directly through your county’s website.
| Year | Tax Paid | Tax Assessment Tax Assessment Total Assessment is a certain percentage of the fair market value that is determined by local assessors to be the total taxable value of land and additions on the property. | Land | Improvement |
|---|---|---|---|---|
| 2025 | $7,558 | $619,049 | $245,166 | $373,883 |
| 2024 | $7,392 | $606,911 | $240,359 | $366,552 |
| 2023 | $7,392 | $595,012 | $235,647 | $359,365 |
| 2022 | $7,124 | $583,346 | $231,027 | $352,319 |
| 2021 | $7,011 | $571,909 | $226,498 | $345,411 |
| 2020 | $7,166 | $566,046 | $224,176 | $341,870 |
| 2019 | $7,131 | $554,948 | $219,781 | $335,167 |
| 2018 | $7,054 | $544,068 | $215,472 | $328,596 |
| 2017 | $6,988 | $533,401 | $211,248 | $322,153 |
| 2016 | $6,566 | $522,943 | $207,106 | $315,837 |
| 2015 | $6,384 | $515,089 | $203,996 | $311,093 |
| 2014 | $6,287 | $505,000 | $200,000 | $305,000 |
Map
- 1433 Birdie Dr
- 1168 Vintage Greens Dr
- 7811 Foppiano Way
- 8396 Trione Cir
- 8148 D St
- 8149 D St
- 8145 Willow St
- 7225 16th Hole Dr
- 8156 D St
- 1038 Capewood Ln
- 8147 Willow St
- 8174 Birch St
- 1138 Broadleaf Ln
- 1349 Golf Course Dr
- 8169 Willow St
- 8182 Willow St
- 8843 Oakfield Ln
- 333 Cornell Stree
- 500 Mark West Station Rd
- 7802 Country Meadow Way
- 7607 Baldocchi Way
- 1237 Mitchell Ln
- 7700 8th Hole Dr
- 7613 Baldocchi Way
- 7694 8th Hole Dr
- 7650 Pallino Ct
- 1228 Mitchell Ln
- 7656 Pallino Ct
- 7619 Baldocchi Way
- 7688 8th Hole Dr
- 7662 Pallino Ct
- 1222 Mitchell Ln
- 7682 8th Hole Dr
- 7625 Baldocchi Way
- 1216 Mitchell Ln
- 7668 Pallino Ct
- 1345 Eagle Dr
- 1339 Eagle Dr
- 7676 8th Hole Dr
- 1210 Mitchell Ln
Ask me questions while you tour the home.