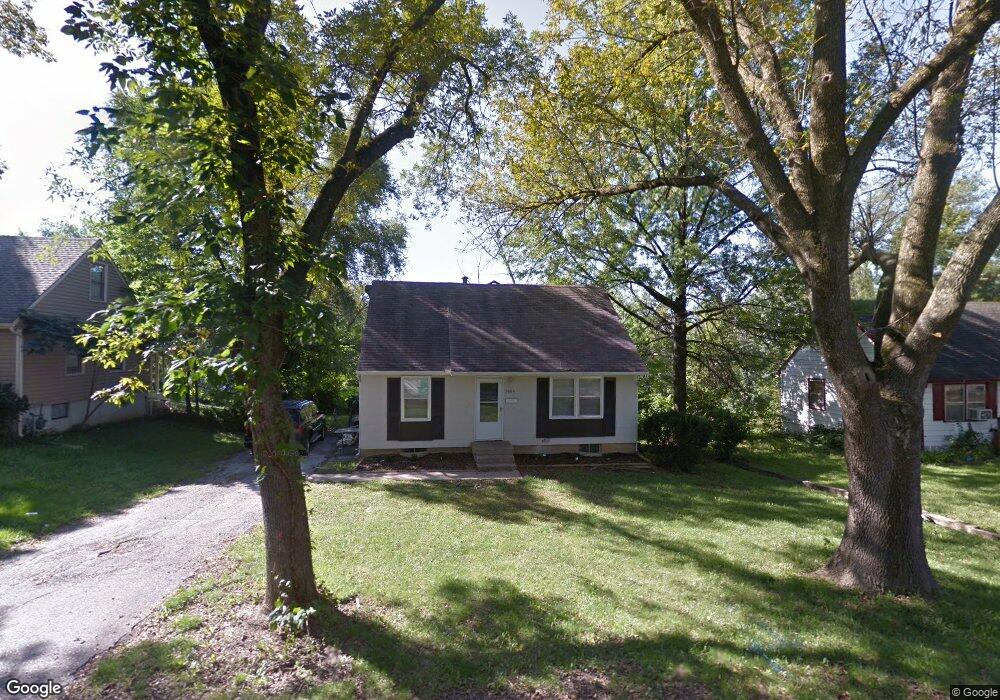
7609 E 50th St Kansas City, MO 64129
Eastwood Hills East NeighborhoodEstimated Value: $150,000 - $185,000
3
Beds
2
Baths
1,229
Sq Ft
$133/Sq Ft
Est. Value
About This Home
This home is located at 7609 E 50th St, Kansas City, MO 64129 and is currently estimated at $162,888, approximately $132 per square foot. 7609 E 50th St is a home located in Jackson County with nearby schools including Eastwood Hills Elementary, Raytown Middle School, and Raytown South High School.
Ownership History
Date
Name
Owned For
Owner Type
Purchase Details
Closed on
Aug 17, 2005
Sold by
Superior Properties Llc
Bought by
Melies Stephen J and Cox Scott
Current Estimated Value
Home Financials for this Owner
Home Financials are based on the most recent Mortgage that was taken out on this home.
Original Mortgage
$57,050
Outstanding Balance
$22,053
Interest Rate
1.65%
Mortgage Type
Fannie Mae Freddie Mac
Estimated Equity
$140,835
Purchase Details
Closed on
Feb 11, 2003
Sold by
Melies Stephen J
Bought by
Superior Properties Llc
Purchase Details
Closed on
May 13, 2002
Sold by
Mortgage One Corp
Bought by
Melies Stephen J
Home Financials for this Owner
Home Financials are based on the most recent Mortgage that was taken out on this home.
Original Mortgage
$53,000
Interest Rate
6.96%
Mortgage Type
Purchase Money Mortgage
Purchase Details
Closed on
Dec 20, 2001
Sold by
Jolliffee Paul D and Jolliffee Dana A
Bought by
Mortgage One Corp and Hfc Mtg Corp
Create a Home Valuation Report for This Property
The Home Valuation Report is an in-depth analysis detailing your home's value as well as a comparison with similar homes in the area
Home Values in the Area
Average Home Value in this Area
Purchase History
| Date | Buyer | Sale Price | Title Company |
|---|---|---|---|
| Melies Stephen J | -- | Commonwealth Title | |
| Superior Properties Llc | -- | -- | |
| Melies Stephen J | -- | -- | |
| Mortgage One Corp | $51,700 | First American Title Ins |
Source: Public Records
Mortgage History
| Date | Status | Borrower | Loan Amount |
|---|---|---|---|
| Open | Melies Stephen J | $57,050 | |
| Previous Owner | Melies Stephen J | $53,000 |
Source: Public Records
Tax History Compared to Growth
Tax History
| Year | Tax Paid | Tax Assessment Tax Assessment Total Assessment is a certain percentage of the fair market value that is determined by local assessors to be the total taxable value of land and additions on the property. | Land | Improvement |
|---|---|---|---|---|
| 2025 | $1,660 | $12,312 | $2,077 | $10,235 |
| 2024 | $1,650 | $18,345 | $1,319 | $17,026 |
| 2023 | $1,650 | $18,345 | $1,163 | $17,182 |
| 2022 | $871 | $9,310 | $1,416 | $7,894 |
| 2021 | $871 | $9,310 | $1,416 | $7,894 |
| 2020 | $874 | $9,230 | $1,416 | $7,814 |
| 2019 | $857 | $9,230 | $1,416 | $7,814 |
| 2018 | $800 | $8,652 | $2,362 | $6,290 |
| 2017 | $800 | $8,652 | $2,362 | $6,290 |
| 2016 | $775 | $8,434 | $1,761 | $6,673 |
| 2014 | $755 | $8,189 | $1,710 | $6,479 |
Source: Public Records
Map
Nearby Homes
- 7509 E 50th St
- 7803 E 50th Terrace
- 7405 E 49th St
- 7504 E 49th St
- 7605 Sni A Bar Terrace
- 7525 E 52nd St
- 7700 E 48th Terrace
- 5002 Skiles Ave
- 7615 E 48th St
- 4701 Skiles Ave
- 5132 Skiles Ave
- 4958 Marsh Ave
- 7152 Sni A Bar Rd
- 6876 Sni A Bar Rd
- 4949 Laramie Ln
- 4881 Wallace Ave
- 6954 E 47th Terrace
- 5117 Booth Ave
- 5119 Booth Ave
- 5140 Booth Ave
- 7701 E 50th St
- 7607 E 50th St
- 7608 E 50th St
- 7703 E 50th St
- 7605 E 50th St
- 7608 E 50th Terrace
- 7606 E 50th Terrace
- 7606 E 50th St
- 7700 E 50th Terrace
- 7604 E 50th Terrace
- 4922 Manchester Ave
- 7604 E 50th St
- 7702 E 50th Terrace
- 7603 E 50th St
- 4920 Manchester Ave
- 5000 Manchester Ave
- 7602 E 50th St
- 7704 E 50th Terrace
- 4918 Manchester Ave
- 7602 E 50th Terrace