
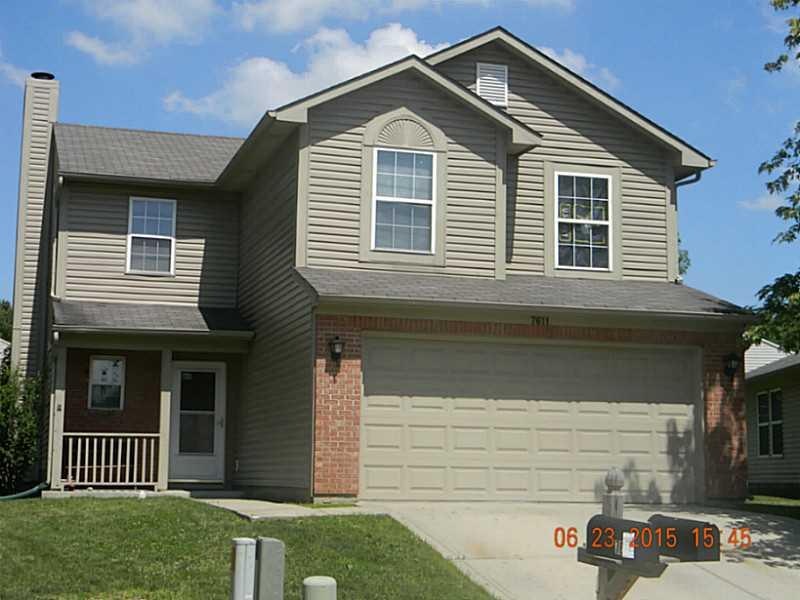
7611 Buck Run Ct Indianapolis, IN 46217
Linden Wood Neighborhood
4
Beds
2.5
Baths
2,020
Sq Ft
5,532
Sq Ft Lot
Highlights
- 1 Fireplace
- Forced Air Heating and Cooling System
- Garage
- Douglas MacArthur Elementary School Rated A-
About This Home
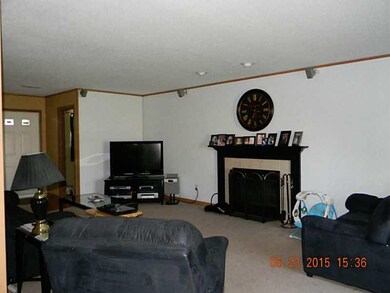
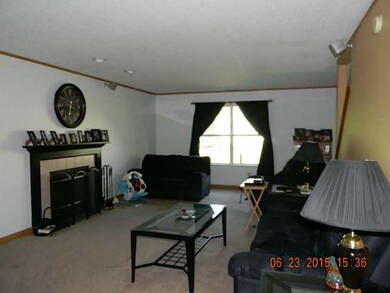
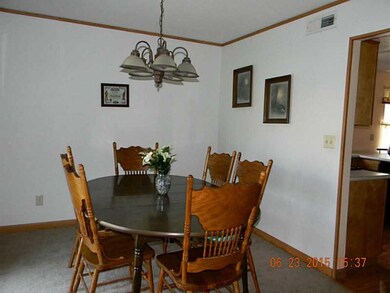
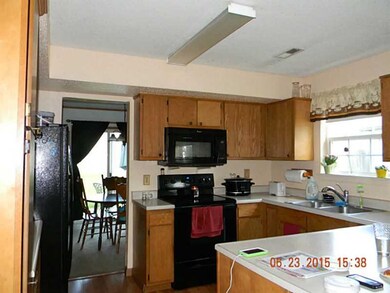
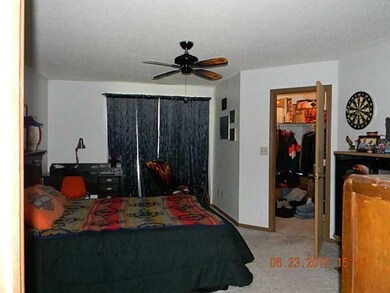
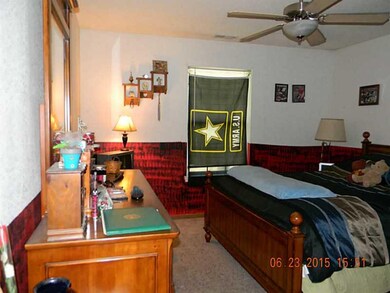
As of August 2015COME CHECK OUT THIS GREAT 4 BDRM, 2 1/2 BA HOME WITH LARGE GREAT RM WITH FIREPLACE. KITCHEN IS PERFECT FOR ENTERTAINING , UPPER LEVEL HAS A BIG MASTER WITH FULL BATH AND A WALKIN CLOSET PLUS 3 GOOD SIZE BEDROOMS. LAUNDRY AREA IS UPSTAIRS MAKING LESS WORK AND RUNNING UP AND DOWN. COME CHECK IT OUT.
Last Buyer's Agent
Sarah Vansickle
Real Broker, LLC
Home Details
Home Type
- Single Family
Est. Annual Taxes
- $1,266
Year Built
- Built in 1999
Home Design
- Slab Foundation
Interior Spaces
- 2-Story Property
- 1 Fireplace
- Fire and Smoke Detector
- Laundry on upper level
Bedrooms and Bathrooms
- 4 Bedrooms
Parking
- Garage
- Driveway
Additional Features
- 5,532 Sq Ft Lot
- Forced Air Heating and Cooling System
Community Details
- Association fees include nature area
- Deerfield Village Subdivision
Listing and Financial Details
- Assessor Parcel Number 491414105127000500
Ownership History
Date
Name
Owned For
Owner Type
Purchase Details
Closed on
Sep 28, 2018
Sold by
Progress Res Borrower 5 Llc
Bought by
Progress Res Borrower 5 Llc
Total Days on Market
11
Current Estimated Value
Home Financials for this Owner
Home Financials are based on the most recent Mortgage that was taken out on this home.
Original Mortgage
$103,318,800
Outstanding Balance
$91,017,916
Interest Rate
4.5%
Mortgage Type
Commercial
Estimated Equity
-$90,741,161
Purchase Details
Closed on
Jul 25, 2016
Sold by
Freo Indiana Llc
Bought by
Progress Residential 2016 & 1 Borrower Llc
Home Financials for this Owner
Home Financials are based on the most recent Mortgage that was taken out on this home.
Original Mortgage
$876,093
Interest Rate
3.41%
Mortgage Type
Commercial
Purchase Details
Listed on
Jun 24, 2015
Closed on
Aug 7, 2015
Sold by
Kendrick Richard A
Bought by
Freo Indiana Llc
Seller's Agent
Rhonda Crowe
Rhonda Crowe
Buyer's Agent
Sarah Vansickle
Real Broker, LLC
List Price
$121,000
Sold Price
$118,000
Premium/Discount to List
-$3,000
-2.48%
Home Financials for this Owner
Home Financials are based on the most recent Mortgage that was taken out on this home.
Avg. Annual Appreciation
9.09%
Purchase Details
Closed on
Jan 6, 2009
Sold by
Warpenburg Rainer
Bought by
Kendrick Richard A
Home Financials for this Owner
Home Financials are based on the most recent Mortgage that was taken out on this home.
Original Mortgage
$96,874
Interest Rate
5.44%
Mortgage Type
FHA
Purchase Details
Closed on
Dec 31, 2007
Sold by
Dodge N P
Bought by
Warpenburg Rainer
Home Financials for this Owner
Home Financials are based on the most recent Mortgage that was taken out on this home.
Original Mortgage
$82,500
Interest Rate
5.95%
Mortgage Type
Unknown
Purchase Details
Closed on
Dec 10, 2007
Sold by
Easton Timothy and Easton Gretchen S
Bought by
Dodge N P and National Equity Inc
Home Financials for this Owner
Home Financials are based on the most recent Mortgage that was taken out on this home.
Original Mortgage
$82,500
Interest Rate
5.95%
Mortgage Type
Unknown
Map
Create a Home Valuation Report for This Property
The Home Valuation Report is an in-depth analysis detailing your home's value as well as a comparison with similar homes in the area
Similar Homes in Indianapolis, IN
Home Values in the Area
Average Home Value in this Area
Purchase History
| Date | Type | Sale Price | Title Company |
|---|---|---|---|
| Interfamily Deed Transfer | -- | None Available | |
| Special Warranty Deed | -- | None Available | |
| Warranty Deed | -- | First American Title Ins Co | |
| Warranty Deed | -- | None Available | |
| Special Warranty Deed | -- | Stewart Title Guaranty Co | |
| Warranty Deed | -- | Stewart Title Guaranty Co |
Source: Public Records
Mortgage History
| Date | Status | Loan Amount | Loan Type |
|---|---|---|---|
| Open | $1,447,545 | Commercial | |
| Open | $103,318,800 | Commercial | |
| Closed | $876,093 | Commercial | |
| Closed | $876,093 | Commercial | |
| Previous Owner | $97,228 | FHA | |
| Previous Owner | $96,874 | FHA | |
| Previous Owner | $82,500 | Unknown |
Source: Public Records
Property History
| Date | Event | Price | Change | Sq Ft Price |
|---|---|---|---|---|
| 11/06/2023 11/06/23 | Rented | $1,650 | 0.0% | -- |
| 10/20/2023 10/20/23 | Under Contract | -- | -- | -- |
| 10/19/2023 10/19/23 | Price Changed | $1,650 | -4.9% | $2 / Sq Ft |
| 10/12/2023 10/12/23 | Price Changed | $1,735 | -3.9% | $2 / Sq Ft |
| 10/06/2023 10/06/23 | Price Changed | $1,805 | -6.0% | $2 / Sq Ft |
| 09/13/2023 09/13/23 | For Rent | $1,920 | +18.5% | -- |
| 07/14/2020 07/14/20 | For Rent | $1,620 | +30.6% | -- |
| 07/14/2020 07/14/20 | Rented | -- | -- | -- |
| 11/28/2017 11/28/17 | Rented | $1,240 | 0.0% | -- |
| 11/10/2017 11/10/17 | Under Contract | -- | -- | -- |
| 10/24/2017 10/24/17 | Price Changed | $1,240 | -10.8% | $1 / Sq Ft |
| 09/18/2017 09/18/17 | For Rent | $1,390 | +7.0% | -- |
| 12/17/2015 12/17/15 | Rented | -- | -- | -- |
| 11/20/2015 11/20/15 | For Rent | $1,299 | 0.0% | -- |
| 08/07/2015 08/07/15 | Sold | $118,000 | -2.5% | $58 / Sq Ft |
| 07/06/2015 07/06/15 | Pending | -- | -- | -- |
| 06/24/2015 06/24/15 | For Sale | $121,000 | -- | $60 / Sq Ft |
Source: MIBOR Broker Listing Cooperative®
Tax History
| Year | Tax Paid | Tax Assessment Tax Assessment Total Assessment is a certain percentage of the fair market value that is determined by local assessors to be the total taxable value of land and additions on the property. | Land | Improvement |
|---|---|---|---|---|
| 2024 | $6,035 | $251,300 | $30,600 | $220,700 |
| 2023 | $6,035 | $233,900 | $30,600 | $203,300 |
| 2022 | $5,592 | $215,300 | $30,600 | $184,700 |
| 2021 | $4,835 | $183,100 | $30,600 | $152,500 |
| 2020 | $4,202 | $157,800 | $30,600 | $127,200 |
| 2019 | $4,228 | $157,900 | $18,800 | $139,100 |
| 2018 | $3,815 | $143,700 | $18,800 | $124,900 |
| 2017 | $3,589 | $134,900 | $18,800 | $116,100 |
| 2016 | $3,395 | $127,300 | $18,800 | $108,500 |
| 2014 | $1,267 | $118,600 | $18,800 | $99,800 |
| 2013 | $1,198 | $114,100 | $18,800 | $95,300 |
Source: Public Records
Source: MIBOR Broker Listing Cooperative®
MLS Number: MBR21361406
APN: 49-14-14-105-127.000-500
Disclaimer: Certain information contained herein is derived from information provided by parties other than Homes.com. All information provided is deemed reliable, but is not guaranteed to be accurate and should be independently verified.
![]() Based on information submitted to the MLS GRID. All data is obtained from various sources and may not have been verified by broker or MLS GRID. Supplied Open House Information is subject to change without notice. All information should be independently reviewed and verified for accuracy. Properties may or may not be listed by the office/agent presenting the information. Some IDX listings have been excluded from this website.
Based on information submitted to the MLS GRID. All data is obtained from various sources and may not have been verified by broker or MLS GRID. Supplied Open House Information is subject to change without notice. All information should be independently reviewed and verified for accuracy. Properties may or may not be listed by the office/agent presenting the information. Some IDX listings have been excluded from this website.
Nearby Homes
- 621 Meadows Edge Ln
- 7611 Misty Meadow Dr
- 539 Deer Trail Dr
- 7659 Misty Meadow Dr
- 607 Deer Trail Dr
- 7702 Mary Ln
- 614 Silver Fox Ct
- 647 W Mcgregor Rd
- 709 Silver Fox Ct
- 831 Wakulla Ct
- 348 W Stop 11 Rd
- 802 Suwanee Ct
- 7838 Burr Oak Ct
- 7303 Beal Ln
- 7953 Forest Park Dr
- 7803 Opelika Ct
- 7133 Mc Lain Dr
- 615 W Stop 11 Rd
- 645 W Stop 11 Rd
- 7109 Chandler Dr