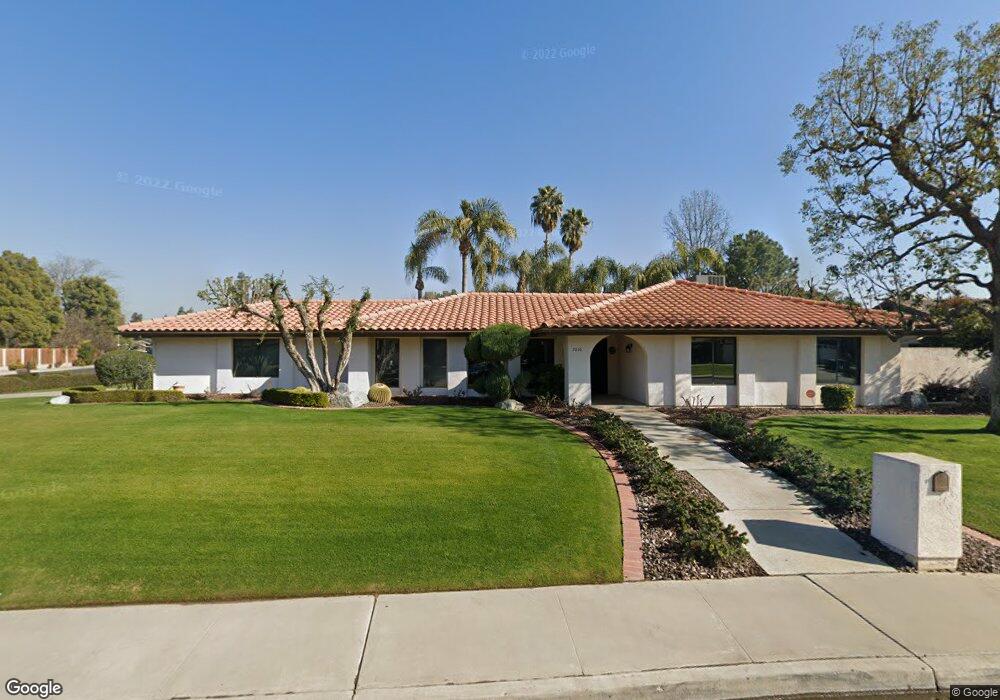
7616 Okanagan Ct Bakersfield, CA 93309
Laurelglen NeighborhoodEstimated Value: $443,000 - $461,400
3
Beds
2
Baths
2,037
Sq Ft
$222/Sq Ft
Est. Value
About This Home
This home is located at 7616 Okanagan Ct, Bakersfield, CA 93309 and is currently estimated at $452,350, approximately $222 per square foot. 7616 Okanagan Ct is a home located in Kern County with nearby schools including Laurelglen Elementary School, Tevis Junior High School, and Bakersfield High School.
Ownership History
Date
Name
Owned For
Owner Type
Purchase Details
Closed on
Mar 9, 2023
Sold by
Bryan Family Trust
Bought by
Din Victoria R
Current Estimated Value
Home Financials for this Owner
Home Financials are based on the most recent Mortgage that was taken out on this home.
Original Mortgage
$366,300
Outstanding Balance
$355,835
Interest Rate
6.65%
Mortgage Type
FHA
Estimated Equity
$96,515
Purchase Details
Closed on
Jan 29, 2007
Sold by
Bryan Richard G and Bryan Roswitha B
Bought by
Bryan Richard G and Bryan Roswitha B
Purchase Details
Closed on
Apr 26, 1996
Sold by
Olmstead Raymond C and Olmstead Shirley A
Bought by
Bryan Richard G and Bryan Roswitha B
Purchase Details
Closed on
Apr 18, 1994
Sold by
Garner James B and Garner Annabel L
Bought by
Olmstead Raymond C and Olmstead Shirley A
Home Financials for this Owner
Home Financials are based on the most recent Mortgage that was taken out on this home.
Original Mortgage
$115,000
Interest Rate
8.1%
Create a Home Valuation Report for This Property
The Home Valuation Report is an in-depth analysis detailing your home's value as well as a comparison with similar homes in the area
Home Values in the Area
Average Home Value in this Area
Purchase History
| Date | Buyer | Sale Price | Title Company |
|---|---|---|---|
| Din Victoria R | $400,000 | Placer Title | |
| Bryan Richard G | -- | None Available | |
| Bryan Richard G | $150,000 | American Title | |
| Olmstead Raymond C | $163,000 | Chicago Title Company |
Source: Public Records
Mortgage History
| Date | Status | Borrower | Loan Amount |
|---|---|---|---|
| Open | Din Victoria R | $366,300 | |
| Previous Owner | Olmstead Raymond C | $115,000 |
Source: Public Records
Tax History Compared to Growth
Tax History
| Year | Tax Paid | Tax Assessment Tax Assessment Total Assessment is a certain percentage of the fair market value that is determined by local assessors to be the total taxable value of land and additions on the property. | Land | Improvement |
|---|---|---|---|---|
| 2025 | $5,554 | $416,160 | $124,848 | $291,312 |
| 2024 | $3,521 | $408,000 | $122,400 | $285,600 |
| 2023 | $3,521 | $239,488 | $55,872 | $183,616 |
| 2022 | $3,379 | $234,793 | $54,777 | $180,016 |
| 2021 | $3,258 | $230,190 | $53,703 | $176,487 |
| 2020 | $3,203 | $227,831 | $53,153 | $174,678 |
| 2019 | $3,161 | $227,831 | $53,153 | $174,678 |
| 2018 | $3,018 | $218,986 | $51,090 | $167,896 |
| 2017 | $2,973 | $214,693 | $50,089 | $164,604 |
| 2016 | $2,779 | $210,484 | $49,107 | $161,377 |
| 2015 | $2,754 | $207,323 | $48,370 | $158,953 |
| 2014 | $2,686 | $203,263 | $47,423 | $155,840 |
Source: Public Records
Map
Nearby Homes
- 7713 Kamloops Dr
- 7321 Alamosa Ln
- 3113 Loveland Way
- 3404 Deming Ct
- 7108 Wilford Ct
- 2601 Manitou Way
- 2707 Hoad Ln
- 7401 Hilton Head Way Unit 21
- 2600 Moffitt Way
- 7804 Revelstoke Way
- 7008 N Half Moon Dr
- 7004 N Half Moon Dr
- 2512 Moffitt Way
- 2508 Moffitt Way
- 7512 Lordsburg Dr
- 2300 El Portal Dr Unit 50
- 2300 El Portal Dr Unit 55
- 2300 El Portal Dr Unit 69
- 2316 Gosford Rd Unit W
- 6900 Palmetto Ct
- 2908 Kootenay Ct
- 7612 Okanagan Ct
- 3009 Bralorne Ct
- 2904 Kootenay Ct
- 7617 Okanagan Ct
- 7608 Okanagan Ct
- 7700 Okanagan Ct
- 7613 Okanagan Ct
- 7701 Okanagan Ct
- 3005 Bralorne Ct
- 7609 Okanagan Ct
- 2900 Kootenay Ct
- 7704 Okanagan Ct
- 7604 Okanagan Ct
- 7601 Kamloops Dr
- 3012 Bralorne Ct
- 7707 Okanagan Ct
- 7607 Okanagan Ct
- 3001 Bralorne Ct
- 7605 Kamloops Dr