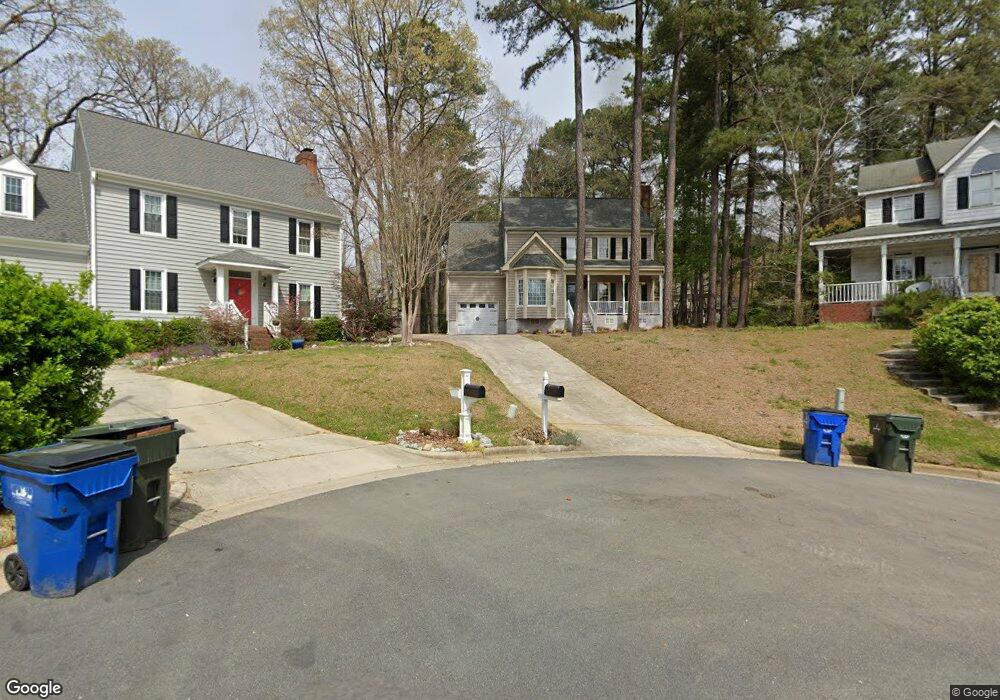
7616 Percy Ct Raleigh, NC 27613
Northwest Raleigh NeighborhoodEstimated Value: $582,989 - $611,000
4
Beds
3
Baths
2,305
Sq Ft
$259/Sq Ft
Est. Value
About This Home
This home is located at 7616 Percy Ct, Raleigh, NC 27613 and is currently estimated at $596,747, approximately $258 per square foot. 7616 Percy Ct is a home located in Wake County with nearby schools including Hilburn Academy, Leesville Road High School, and The Montessori School of Raleigh.
Ownership History
Date
Name
Owned For
Owner Type
Purchase Details
Closed on
Sep 26, 2019
Sold by
Armstrong Timothy J and Armstrong Lindsey
Bought by
Denoo David Arthur
Current Estimated Value
Home Financials for this Owner
Home Financials are based on the most recent Mortgage that was taken out on this home.
Original Mortgage
$301,750
Outstanding Balance
$264,887
Interest Rate
3.6%
Mortgage Type
New Conventional
Estimated Equity
$331,860
Purchase Details
Closed on
Aug 13, 2012
Sold by
Monaghan Lindsey B and Armstrong Timothy J
Bought by
Armstrong Timothy J and Armstrong Lindsey
Purchase Details
Closed on
Oct 29, 2009
Sold by
Covely Shawn A and Covely Wendy M
Bought by
Monaghan Lindsey B and Armstrong Timothy J
Home Financials for this Owner
Home Financials are based on the most recent Mortgage that was taken out on this home.
Original Mortgage
$269,920
Interest Rate
5.04%
Mortgage Type
FHA
Purchase Details
Closed on
Jun 29, 2005
Sold by
Sparkman Rachel E
Bought by
Covely Shawn A and Covely Wendy M
Home Financials for this Owner
Home Financials are based on the most recent Mortgage that was taken out on this home.
Original Mortgage
$234,000
Interest Rate
5.66%
Mortgage Type
Fannie Mae Freddie Mac
Create a Home Valuation Report for This Property
The Home Valuation Report is an in-depth analysis detailing your home's value as well as a comparison with similar homes in the area
Home Values in the Area
Average Home Value in this Area
Purchase History
| Date | Buyer | Sale Price | Title Company |
|---|---|---|---|
| Denoo David Arthur | $355,000 | None Available | |
| Armstrong Timothy J | -- | None Available | |
| Monaghan Lindsey B | $275,000 | None Available | |
| Covely Shawn A | $234,000 | -- |
Source: Public Records
Mortgage History
| Date | Status | Borrower | Loan Amount |
|---|---|---|---|
| Open | Denoo David Arthur | $301,750 | |
| Previous Owner | Monaghan Lindsey B | $269,920 | |
| Previous Owner | Covely Shawn A | $234,000 |
Source: Public Records
Tax History Compared to Growth
Tax History
| Year | Tax Paid | Tax Assessment Tax Assessment Total Assessment is a certain percentage of the fair market value that is determined by local assessors to be the total taxable value of land and additions on the property. | Land | Improvement |
|---|---|---|---|---|
| 2025 | $4,584 | $523,377 | $145,000 | $378,377 |
| 2024 | $4,566 | $523,377 | $145,000 | $378,377 |
| 2023 | $3,522 | $321,299 | $100,000 | $221,299 |
| 2022 | $3,273 | $321,299 | $100,000 | $221,299 |
| 2021 | $3,146 | $321,299 | $100,000 | $221,299 |
| 2020 | $3,089 | $321,299 | $100,000 | $221,299 |
| 2019 | $3,329 | $285,558 | $100,000 | $185,558 |
| 2018 | $3,140 | $285,558 | $100,000 | $185,558 |
| 2017 | $2,991 | $285,558 | $100,000 | $185,558 |
| 2016 | $2,929 | $285,558 | $100,000 | $185,558 |
| 2015 | $2,853 | $273,579 | $90,000 | $183,579 |
| 2014 | $2,706 | $273,579 | $90,000 | $183,579 |
Source: Public Records
Map
Nearby Homes
- 7613 Percy Ct
- 8713 Little Deer Ln
- 6063 Epping Forest Dr
- 6051 Epping Forest Dr
- 502 Plumleaf Rd
- 6036 Epping Forest Dr
- 4211 Norman Ridge Ln
- 7417 Fontana Ridge Ln
- 4103 Landfall Ct
- 4536 Hamptonshire Dr
- 4416 Lancashire Dr
- 3811 Lunceston Way Unit 208
- 4541 Hershey Ct
- 6736 Hammersmith Dr
- 5145 Landguard Dr
- 4104 Betterton Dr
- 5548 Red Robin Rd
- 5529 Golden Arrow Ln
- 7253 Galon Glen Rd
- 7440 Lagrange Dr
- 7617 Percy Ct
- 7612 Percy Ct
- 7704 Hilburn Dr
- 7708 Hilburn Dr
- 4409 Sprague Rd
- 7608 Percy Ct
- 7700 Hilburn Dr
- 7712 Hilburn Dr
- 7609 Percy Ct
- 7604 Percy Ct
- 4417 Sprague Rd
- 7601 Percy Ct
- 4508 Pike Rd
- 4421 Sprague Rd
- 4401 Sprague Rd
- 4436 Pike Rd
- 4432 Pike Rd
- 4432 Pike Rd Unit 1
- 4500 Gwynnebrook Cir
- 7705 Hilburn Dr