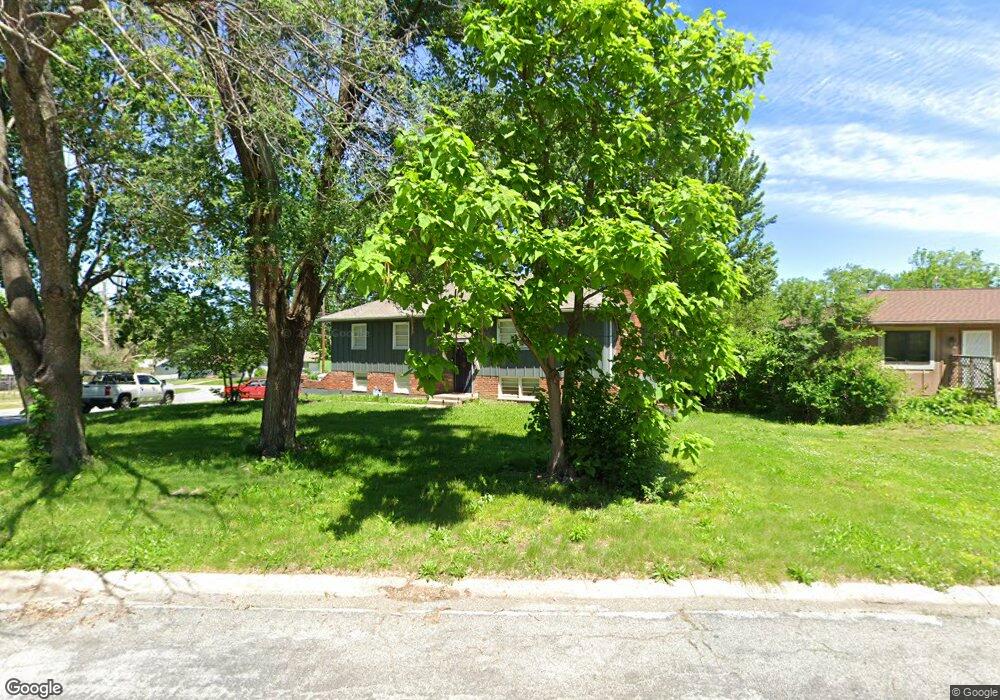
7622 E 52nd St Kansas City, MO 64129
Eastwood Hills East NeighborhoodEstimated Value: $178,000 - $206,000
3
Beds
3
Baths
1,248
Sq Ft
$156/Sq Ft
Est. Value
About This Home
This home is located at 7622 E 52nd St, Kansas City, MO 64129 and is currently estimated at $194,774, approximately $156 per square foot. 7622 E 52nd St is a home located in Jackson County with nearby schools including Eastwood Hills Elementary, Raytown Middle School, and Raytown South High School.
Ownership History
Date
Name
Owned For
Owner Type
Purchase Details
Closed on
Jun 28, 2022
Sold by
1 Cash Flow Source Llc
Bought by
Brandsma Nicholas
Current Estimated Value
Home Financials for this Owner
Home Financials are based on the most recent Mortgage that was taken out on this home.
Original Mortgage
$141,000
Outstanding Balance
$134,139
Interest Rate
5.25%
Mortgage Type
New Conventional
Estimated Equity
$60,635
Purchase Details
Closed on
Feb 22, 2022
Sold by
William Martinez Jr Mark and William Jennifer L
Bought by
1 Cash Flow Source Llc
Purchase Details
Closed on
Jan 2, 2020
Sold by
1 Big Red Llc
Bought by
Martinez Mark William
Home Financials for this Owner
Home Financials are based on the most recent Mortgage that was taken out on this home.
Original Mortgage
$101,600
Interest Rate
3.6%
Mortgage Type
New Conventional
Purchase Details
Closed on
Feb 24, 2017
Sold by
Us Real Estate Equity Builder Llc
Bought by
Hines Robert
Home Financials for this Owner
Home Financials are based on the most recent Mortgage that was taken out on this home.
Original Mortgage
$64,750
Interest Rate
4.12%
Mortgage Type
New Conventional
Purchase Details
Closed on
Sep 26, 2016
Sold by
Us Bank National Association
Bought by
Us Real Estate Equity Builder Llc
Home Financials for this Owner
Home Financials are based on the most recent Mortgage that was taken out on this home.
Original Mortgage
$55,000
Interest Rate
3.5%
Mortgage Type
New Conventional
Purchase Details
Closed on
Aug 4, 2016
Sold by
Carwford Raeshel R
Bought by
Us Bank National Association
Home Financials for this Owner
Home Financials are based on the most recent Mortgage that was taken out on this home.
Original Mortgage
$55,000
Interest Rate
3.5%
Mortgage Type
New Conventional
Purchase Details
Closed on
May 20, 2011
Sold by
Adams Richard K and Adams Melissa J A
Bought by
Crawford Raeshel
Home Financials for this Owner
Home Financials are based on the most recent Mortgage that was taken out on this home.
Original Mortgage
$75,534
Interest Rate
4.91%
Mortgage Type
FHA
Purchase Details
Closed on
Jan 26, 2009
Sold by
Sellers Carrie S and Sellers Raymond E
Bought by
Adams Melissa J A
Home Financials for this Owner
Home Financials are based on the most recent Mortgage that was taken out on this home.
Original Mortgage
$62,840
Interest Rate
5.06%
Mortgage Type
FHA
Purchase Details
Closed on
Jul 23, 2007
Sold by
Ellingsworth Helen E and Banner Kenneth
Bought by
Sellers Carrie S
Create a Home Valuation Report for This Property
The Home Valuation Report is an in-depth analysis detailing your home's value as well as a comparison with similar homes in the area
Home Values in the Area
Average Home Value in this Area
Purchase History
| Date | Buyer | Sale Price | Title Company |
|---|---|---|---|
| Brandsma Nicholas | -- | None Listed On Document | |
| 1 Cash Flow Source Llc | -- | None Listed On Document | |
| 1 Cash Flow Source Llc | -- | None Listed On Document | |
| Martinez Mark William | -- | None Available | |
| 1 Big Red Llc | -- | None Available | |
| Hines Robert | -- | Advantage Title Llc | |
| Us Real Estate Equity Builder Llc | $50,000 | None Available | |
| Us Bank National Association | $51,350 | None Available | |
| Crawford Raeshel | -- | First American Title | |
| Adams Melissa J A | -- | Accommodation | |
| Sellers Carrie S | -- | None Available |
Source: Public Records
Mortgage History
| Date | Status | Borrower | Loan Amount |
|---|---|---|---|
| Open | Brandsma Nicholas | $141,000 | |
| Previous Owner | Martinez Mark William | $101,600 | |
| Previous Owner | Hines Robert | $64,750 | |
| Previous Owner | Us Real Estate Equity Builder Llc | $55,000 | |
| Previous Owner | Crawford Raeshel | $75,534 | |
| Previous Owner | Adams Melissa J A | $62,840 |
Source: Public Records
Tax History Compared to Growth
Tax History
| Year | Tax Paid | Tax Assessment Tax Assessment Total Assessment is a certain percentage of the fair market value that is determined by local assessors to be the total taxable value of land and additions on the property. | Land | Improvement |
|---|---|---|---|---|
| 2025 | $2,934 | $19,598 | $2,367 | $17,231 |
| 2024 | $2,934 | $32,412 | $3,158 | $29,254 |
| 2023 | $2,915 | $32,412 | $2,732 | $29,680 |
| 2022 | $1,386 | $14,820 | $1,720 | $13,100 |
| 2021 | $1,386 | $14,820 | $1,720 | $13,100 |
| 2020 | $1,406 | $14,849 | $1,720 | $13,129 |
| 2019 | $1,379 | $14,849 | $1,720 | $13,129 |
| 2018 | $1,274 | $13,770 | $3,088 | $10,682 |
| 2017 | $1,274 | $13,770 | $3,088 | $10,682 |
| 2016 | $1,233 | $13,425 | $1,957 | $11,468 |
| 2014 | $1,202 | $13,034 | $1,900 | $11,134 |
Source: Public Records
Map
Nearby Homes
- 7525 E 52nd St
- 7803 E 50th Terrace
- 7509 E 50th St
- 7405 E 49th St
- 5132 Skiles Ave
- 7504 E 49th St
- 4701 Skiles Ave
- 5002 Skiles Ave
- 7605 Sni A Bar Terrace
- 4958 Marsh Ave
- 7700 E 48th Terrace
- 7615 E 48th St
- 7152 Sni A Bar Rd
- 7102 E 55th St
- 5140 Booth Ave
- 5117 Booth Ave
- 6876 Sni A Bar Rd
- 5609 Oakland Ave
- 4949 Laramie Ln
- 6800 Blue Pkwy
- 7628 E 52nd St
- 7618 E 52nd St
- 7621 E 52nd St
- 7616 E 51st Terrace
- 7627 E 52nd St
- 7634 E 52nd St
- 7617 E 52nd St
- 7633 E 52nd St
- 7612 E 51st Terrace
- 7612 E 52nd St
- 7700 E 52nd St
- 7607 E 51st Terrace
- 7611 E 52nd St
- 7701 E 52nd St
- 7608 E 51st Terrace
- 7606 E 52nd St
- 5118 Palmer Dr
- 5122 Palmer Dr
- 7607 E 52nd St
- 7706 E 52nd St