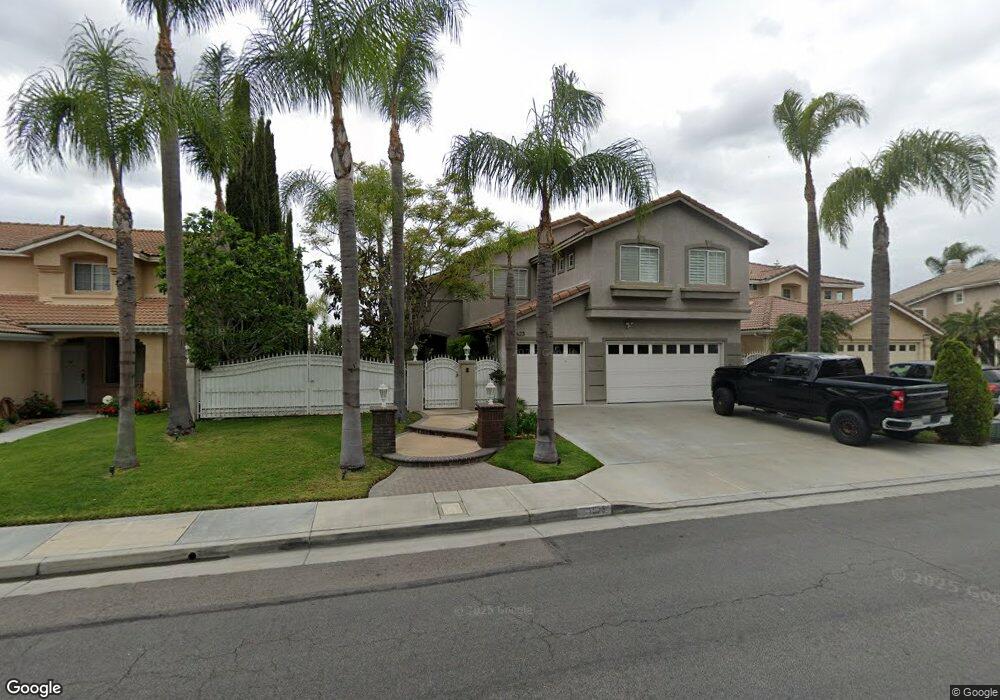
7623 E Moonridge Ln Anaheim, CA 92808
Anaheim Hills NeighborhoodEstimated Value: $1,576,000 - $1,764,000
5
Beds
3
Baths
2,661
Sq Ft
$621/Sq Ft
Est. Value
About This Home
This home is located at 7623 E Moonridge Ln, Anaheim, CA 92808 and is currently estimated at $1,653,185, approximately $621 per square foot. 7623 E Moonridge Ln is a home located in Orange County with nearby schools including Canyon Rim Elementary, Canyon High School, and El Rancho Charter.
Ownership History
Date
Name
Owned For
Owner Type
Purchase Details
Closed on
Nov 6, 2023
Sold by
Nakhla Yvette
Bought by
Yvette Nakhla Living Trust and Nakhla
Current Estimated Value
Purchase Details
Closed on
Jun 25, 2018
Sold by
Gurigis Sameh
Bought by
Nakhla Yvette
Purchase Details
Closed on
Feb 9, 2011
Sold by
Guirgis Sameh and Nakhla Yvette
Bought by
Aurora Loan Services Llc
Purchase Details
Closed on
Jul 6, 2005
Sold by
Kweider M H and Jibbeh Rima Al
Bought by
Guirgis Sameh and Nakhla Yvette
Home Financials for this Owner
Home Financials are based on the most recent Mortgage that was taken out on this home.
Original Mortgage
$775,200
Interest Rate
5.43%
Mortgage Type
Purchase Money Mortgage
Purchase Details
Closed on
Feb 20, 1997
Sold by
Presley Homes
Bought by
Kweider M H and Jibbeh Rima Al
Home Financials for this Owner
Home Financials are based on the most recent Mortgage that was taken out on this home.
Original Mortgage
$237,320
Interest Rate
7.9%
Create a Home Valuation Report for This Property
The Home Valuation Report is an in-depth analysis detailing your home's value as well as a comparison with similar homes in the area
Home Values in the Area
Average Home Value in this Area
Purchase History
| Date | Buyer | Sale Price | Title Company |
|---|---|---|---|
| Yvette Nakhla Living Trust | -- | None Listed On Document | |
| Nakhla Yvette | -- | None Available | |
| Aurora Loan Services Llc | $796,440 | Accommodation | |
| Guirgis Sameh | $969,000 | Stewart Title Company | |
| Kweider M H | $297,000 | First American Title Ins Co |
Source: Public Records
Mortgage History
| Date | Status | Borrower | Loan Amount |
|---|---|---|---|
| Previous Owner | Guirgis Sameh | $775,200 | |
| Previous Owner | Kweider M H | $237,320 |
Source: Public Records
Tax History Compared to Growth
Tax History
| Year | Tax Paid | Tax Assessment Tax Assessment Total Assessment is a certain percentage of the fair market value that is determined by local assessors to be the total taxable value of land and additions on the property. | Land | Improvement |
|---|---|---|---|---|
| 2025 | $14,044 | $1,324,212 | $829,581 | $494,631 |
| 2024 | $14,044 | $1,298,248 | $813,315 | $484,933 |
| 2023 | $10,630 | $978,432 | $545,935 | $432,497 |
| 2022 | $10,426 | $959,248 | $535,231 | $424,017 |
| 2021 | $10,130 | $940,440 | $524,737 | $415,703 |
| 2020 | $10,138 | $940,440 | $524,737 | $415,703 |
| 2019 | $10,006 | $922,000 | $514,448 | $407,552 |
| 2018 | $8,868 | $803,950 | $388,248 | $415,702 |
| 2017 | $8,495 | $788,187 | $380,636 | $407,551 |
| 2016 | $8,330 | $772,733 | $373,173 | $399,560 |
| 2015 | $8,154 | $761,126 | $367,567 | $393,559 |
| 2014 | $8,049 | $746,217 | $360,367 | $385,850 |
Source: Public Records
Map
Nearby Homes
- 7572 E Endemont Ct
- 7750 E Portofino Ave
- 7912 E Monte Carlo Ave
- 7859 E Quinn Dr
- 712 S Lost Canyon Rd
- 7921 E Quinn Dr
- 7939 E Quinn Dr
- 7917 E Viewrim Dr
- 7847 E Margaret Ct
- 760 S Thrasher Way
- 414 S Cooks Corner
- 8205 E Somerset Ln
- 1082 S Rossano Way
- 1062 S Romano Ct
- 7653 E Corto Rd
- 1008 S Rossano Way Unit 20
- 8027 E Naples Ln
- 1041 S San Marino Way
- 8025 E Sandstone Dr
- 8039 E Snapdragon Ln Unit 6
- 7617 E Moonridge Ln
- 7629 E Moonridge Ln
- 7611 E Moonridge Ln
- 7635 E Moonridge Ln
- 910 S Matthew Way
- 902 S Matthew Way
- 918 S Matthew Way
- 7641 E Moonridge Ln
- 7605 E Moonridge Ln
- 924 S Matthew Way
- 929 S Brianna Way
- 935 S Brianna Way
- 923 S Brianna Way
- 7647 E Moonridge Ln
- 941 S Brianna Way
- 932 S Matthew Way
- 7599 E Moonridge Ln
- 947 S Brianna Way
- 917 S Brianna Way
- 940 S Matthew Way