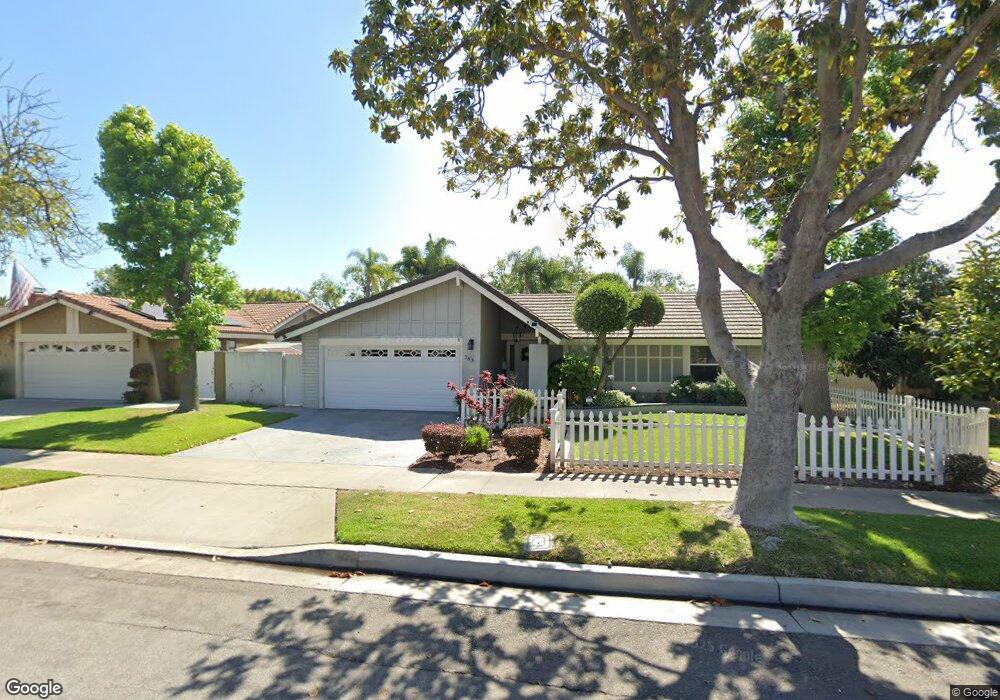
763 S Breezy Way Orange, CA 92869
Estimated Value: $1,110,000 - $1,227,271
3
Beds
2
Baths
1,727
Sq Ft
$690/Sq Ft
Est. Value
About This Home
This home is located at 763 S Breezy Way, Orange, CA 92869 and is currently estimated at $1,192,068, approximately $690 per square foot. 763 S Breezy Way is a home located in Orange County with nearby schools including La Veta Elementary School, El Modena High School, and Spirit Christian Academy.
Ownership History
Date
Name
Owned For
Owner Type
Purchase Details
Closed on
Jun 8, 2001
Sold by
Montevideo Deborah J and Gardner Deborah J
Bought by
Hall Richard E and Hall Susan C
Current Estimated Value
Home Financials for this Owner
Home Financials are based on the most recent Mortgage that was taken out on this home.
Original Mortgage
$220,000
Outstanding Balance
$90,564
Interest Rate
8.25%
Estimated Equity
$1,101,504
Purchase Details
Closed on
Nov 7, 1993
Sold by
Gardner Deborah J
Bought by
Gardner Deborah J
Home Financials for this Owner
Home Financials are based on the most recent Mortgage that was taken out on this home.
Original Mortgage
$103,000
Interest Rate
7.21%
Purchase Details
Closed on
Mar 1, 1993
Sold by
Gardner David L
Bought by
Gardner Deborah J
Create a Home Valuation Report for This Property
The Home Valuation Report is an in-depth analysis detailing your home's value as well as a comparison with similar homes in the area
Home Values in the Area
Average Home Value in this Area
Purchase History
| Date | Buyer | Sale Price | Title Company |
|---|---|---|---|
| Hall Richard E | $275,000 | Chicago Title Co | |
| Montevideo Deborah J | -- | Chicago Title Co | |
| Gardner Deborah J | -- | Gateway Title Company | |
| Gardner Deborah J | -- | -- |
Source: Public Records
Mortgage History
| Date | Status | Borrower | Loan Amount |
|---|---|---|---|
| Open | Hall Richard E | $220,000 | |
| Previous Owner | Gardner Deborah J | $103,000 | |
| Closed | Hall Richard E | $50,000 |
Source: Public Records
Tax History Compared to Growth
Tax History
| Year | Tax Paid | Tax Assessment Tax Assessment Total Assessment is a certain percentage of the fair market value that is determined by local assessors to be the total taxable value of land and additions on the property. | Land | Improvement |
|---|---|---|---|---|
| 2025 | $4,529 | $406,244 | $259,866 | $146,378 |
| 2024 | $4,529 | $398,279 | $254,771 | $143,508 |
| 2023 | $4,426 | $390,470 | $249,775 | $140,695 |
| 2022 | $4,338 | $382,814 | $244,877 | $137,937 |
| 2021 | $4,217 | $375,308 | $240,075 | $135,233 |
| 2020 | $4,178 | $371,460 | $237,613 | $133,847 |
| 2019 | $4,125 | $364,177 | $232,954 | $131,223 |
| 2018 | $4,062 | $357,037 | $228,387 | $128,650 |
| 2017 | $3,895 | $350,037 | $223,909 | $126,128 |
| 2016 | $3,820 | $343,174 | $219,519 | $123,655 |
| 2015 | $3,763 | $338,020 | $216,222 | $121,798 |
| 2014 | $3,682 | $331,399 | $211,986 | $119,413 |
Source: Public Records
Map
Nearby Homes
- 700 S Yorba St
- 552 S Yorba St
- 2411 Deodar St Unit 2
- 2608 N Tustin Ave
- 2518 N Tustin Ave Unit E
- 2514 N Tustin Ave Unit 71
- 2516 N Tustin Ave Unit A
- 2602 N Tustin Ave Unit D
- 2717 Dayna St
- 3315 E Romelle Ave
- 17991 Lassen Dr
- 308 S Craig Dr
- 13441 Laurinda Way
- 360 S Greengrove Dr
- 1024 E Tularosa Ave
- 13702 Loretta Dr
- 17562 Laurie Ln
- 13082 Palomar Way
- 129 S Kathleen Ln
- 13762 Palace Way
- 751 S Breezy Way
- 773 S Breezy Way
- 764 S Lowry St
- 774 S Lowry St
- 741 S Breezy Way
- 785 S Breezy Way
- 754 S Lowry St
- 784 S Lowry St
- 762 S Breezy Way
- 744 S Lowry St
- 731 S Breezy Way
- 754 S Breezy Way
- 772 S Breezy Way
- 742 S Breezy Way
- 784 S Breezy Way
- 805 S Breezy Way
- 724 S Lowry St
- 721 S Breezy Way
- 763 S Lowry St
- 773 S Lowry St