7630 Sleepy Summit Ln Fairview, TN 37062
Estimated Value: $636,000 - $722,000
Studio
4
Baths
2,215
Sq Ft
$308/Sq Ft
Est. Value
About This Home
This home is located at 7630 Sleepy Summit Ln, Fairview, TN 37062 and is currently estimated at $681,140, approximately $307 per square foot. 7630 Sleepy Summit Ln is a home located in Williamson County with nearby schools including Fairview Elementary School, Fairview Middle School, and Fairview High School.
Ownership History
Date
Name
Owned For
Owner Type
Purchase Details
Closed on
Jan 28, 2008
Sold by
Bateman Amy L and Bateman Roger Dale
Bought by
Kelley Mark A
Current Estimated Value
Purchase Details
Closed on
Dec 27, 2007
Sold by
Bateman Roger Dale
Bought by
Bateman Amy L
Purchase Details
Closed on
Jun 3, 2000
Sold by
Robinson William Allison and Robinson Elizabeth Perdue
Bought by
Bateman Roger Dale and Bateman Amy L
Home Financials for this Owner
Home Financials are based on the most recent Mortgage that was taken out on this home.
Original Mortgage
$155,000
Interest Rate
8.11%
Mortgage Type
Construction
Create a Home Valuation Report for This Property
The Home Valuation Report is an in-depth analysis detailing your home's value as well as a comparison with similar homes in the area
Home Values in the Area
Average Home Value in this Area
Purchase History
| Date | Buyer | Sale Price | Title Company |
|---|---|---|---|
| Kelley Mark A | $267,300 | None Available | |
| Bateman Amy L | -- | None Available | |
| Bateman Roger Dale | $36,005 | -- |
Source: Public Records
Mortgage History
| Date | Status | Borrower | Loan Amount |
|---|---|---|---|
| Previous Owner | Bateman Roger Dale | $155,000 |
Source: Public Records
Tax History
| Year | Tax Paid | Tax Assessment Tax Assessment Total Assessment is a certain percentage of the fair market value that is determined by local assessors to be the total taxable value of land and additions on the property. | Land | Improvement |
|---|---|---|---|---|
| 2025 | $1,803 | $147,250 | $62,750 | $84,500 |
| 2024 | $1,803 | $95,925 | $26,825 | $69,100 |
| 2023 | $1,803 | $95,925 | $26,825 | $69,100 |
| 2022 | $1,803 | $95,925 | $26,825 | $69,100 |
| 2021 | $1,803 | $95,925 | $26,825 | $69,100 |
| 2020 | $1,762 | $79,350 | $17,875 | $61,475 |
| 2019 | $1,762 | $79,350 | $17,875 | $61,475 |
| 2018 | $1,706 | $79,350 | $17,875 | $61,475 |
| 2017 | $1,706 | $79,350 | $17,875 | $61,475 |
Source: Public Records
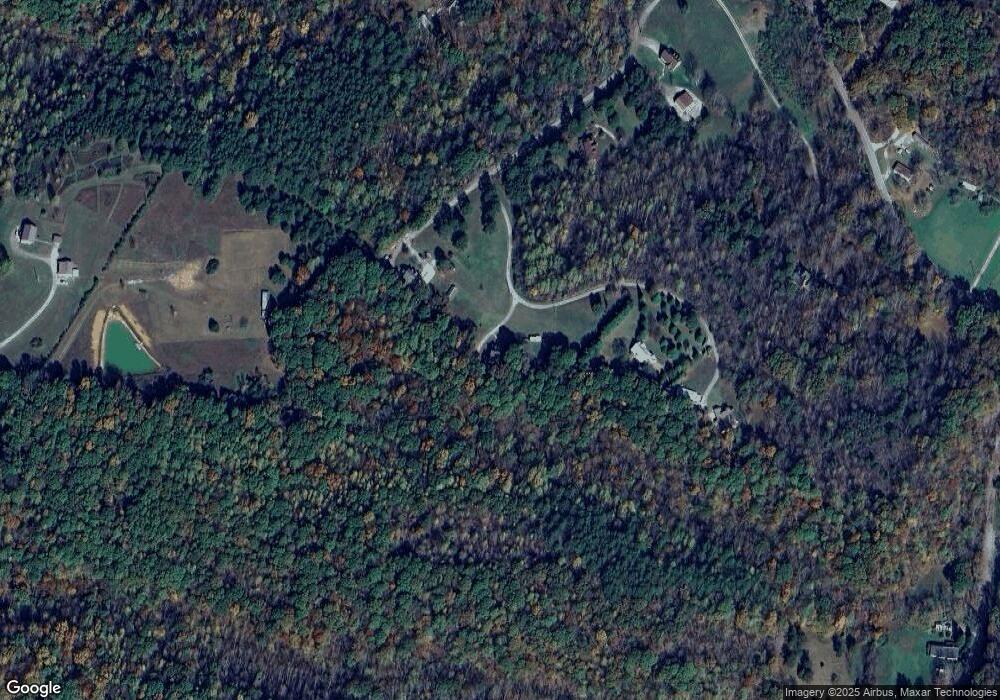
Map
Nearby Homes
- 7725 Caney Fork Rd
- 7340 Southern Rd
- 7109 King Rd
- 7399 Forrest Glenn Rd
- 7228 Mccormick Ln
- 7331 Mccormick Dr
- 2013 Ambie Way
- 7315 Mccormick Dr
- 6004 Venable Ct
- 5015 Bobo Ct
- 7019 Sully Ct
- 7021 Sully Ct
- 7010 Sully Ct
- 7008 Sully Ct
- 1006 Wiseman Farm Rd
- 7017 Sully Ct
- 9017 Ada Way
- 9013 Ada Way
- 9021 Ada Way
- 7379 Overby Rd
- 7620 Sleepy Summit Ln
- 7640 Sleepy Summit Ln
- 7610 Sleepy Summit Ln
- 7650 Sleepy Summit Ln
- 7460 Sleepy Summit Rd
- 7410 Sleepy Hollow Ln Unit 2
- 7420 Sleepy Hollow Ln Unit 3
- 7420 Sleepy Hollow Ln
- 7430 Sleepy Hollow Ln
- 7430 Sleepy Hollow Ln
- 7487 Sleepy Hollow Rd
- 7440 Sleepy Hollow Ln
- 7483 Sleepy Hollow Rd
- 7714 Caney Fork Rd
- 7262 Deer Ridge Rd
- 8018 Rose Ridge Ln
- 7720 Caney Fork Rd
- 7710 Caney Fork Rd
- 8012 Rose Ridge Ln
- 7500 Sleepy Hollow Rd
Your Personal Tour Guide
Ask me questions while you tour the home.