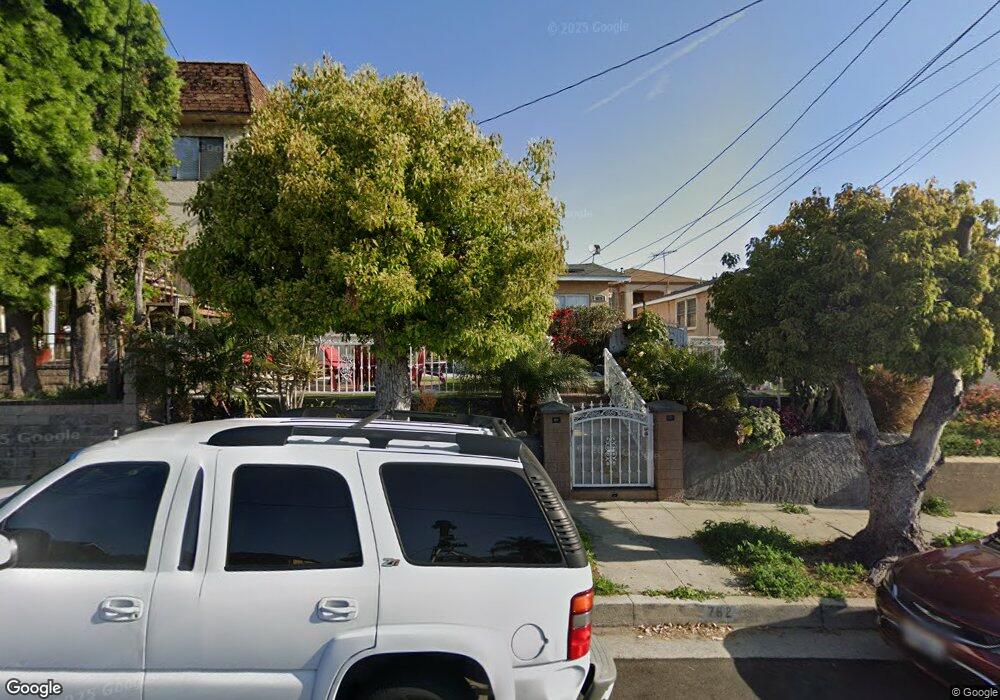
764 W 5th St San Pedro, CA 90731
Estimated Value: $819,000 - $905,730
4
Beds
3
Baths
1,768
Sq Ft
$483/Sq Ft
Est. Value
About This Home
This home is located at 764 W 5th St, San Pedro, CA 90731 and is currently estimated at $853,933, approximately $482 per square foot. 764 W 5th St is a home located in Los Angeles County with nearby schools including Cabrillo Avenue Elementary School, Dana Middle School, and San Pedro Senior High School.
Ownership History
Date
Name
Owned For
Owner Type
Purchase Details
Closed on
May 18, 2013
Sold by
Quintana Pedro A and Quintana Maria Guadalupe
Bought by
Quintana Pedro A
Current Estimated Value
Home Financials for this Owner
Home Financials are based on the most recent Mortgage that was taken out on this home.
Original Mortgage
$302,500
Outstanding Balance
$213,679
Interest Rate
3.41%
Mortgage Type
New Conventional
Estimated Equity
$640,254
Purchase Details
Closed on
Jan 29, 2002
Sold by
Mendoza Jose A and Mendoza Erendira O
Bought by
Quintana Pedro A
Home Financials for this Owner
Home Financials are based on the most recent Mortgage that was taken out on this home.
Original Mortgage
$212,000
Interest Rate
8.25%
Create a Home Valuation Report for This Property
The Home Valuation Report is an in-depth analysis detailing your home's value as well as a comparison with similar homes in the area
Home Values in the Area
Average Home Value in this Area
Purchase History
| Date | Buyer | Sale Price | Title Company |
|---|---|---|---|
| Quintana Pedro A | -- | Title365 Company | |
| Quintana Pedro A | $265,000 | Commonwealth Title |
Source: Public Records
Mortgage History
| Date | Status | Borrower | Loan Amount |
|---|---|---|---|
| Open | Quintana Pedro A | $302,500 | |
| Previous Owner | Quintana Pedro A | $212,000 | |
| Closed | Quintana Pedro A | $39,750 |
Source: Public Records
Tax History Compared to Growth
Tax History
| Year | Tax Paid | Tax Assessment Tax Assessment Total Assessment is a certain percentage of the fair market value that is determined by local assessors to be the total taxable value of land and additions on the property. | Land | Improvement |
|---|---|---|---|---|
| 2025 | $4,861 | $391,461 | $273,289 | $118,172 |
| 2024 | $4,861 | $383,786 | $267,931 | $115,855 |
| 2023 | $4,769 | $376,262 | $262,678 | $113,584 |
| 2022 | $4,552 | $368,885 | $257,528 | $111,357 |
| 2021 | $4,489 | $361,653 | $252,479 | $109,174 |
| 2020 | $4,529 | $357,946 | $249,891 | $108,055 |
| 2019 | $4,356 | $350,929 | $244,992 | $105,937 |
| 2018 | $4,256 | $344,049 | $240,189 | $103,860 |
| 2017 | $4,161 | $337,304 | $235,480 | $101,824 |
| 2016 | $4,052 | $330,691 | $230,863 | $99,828 |
| 2015 | $3,993 | $325,725 | $227,396 | $98,329 |
| 2014 | $4,023 | $319,345 | $222,942 | $96,403 |
Source: Public Records
Map
Nearby Homes