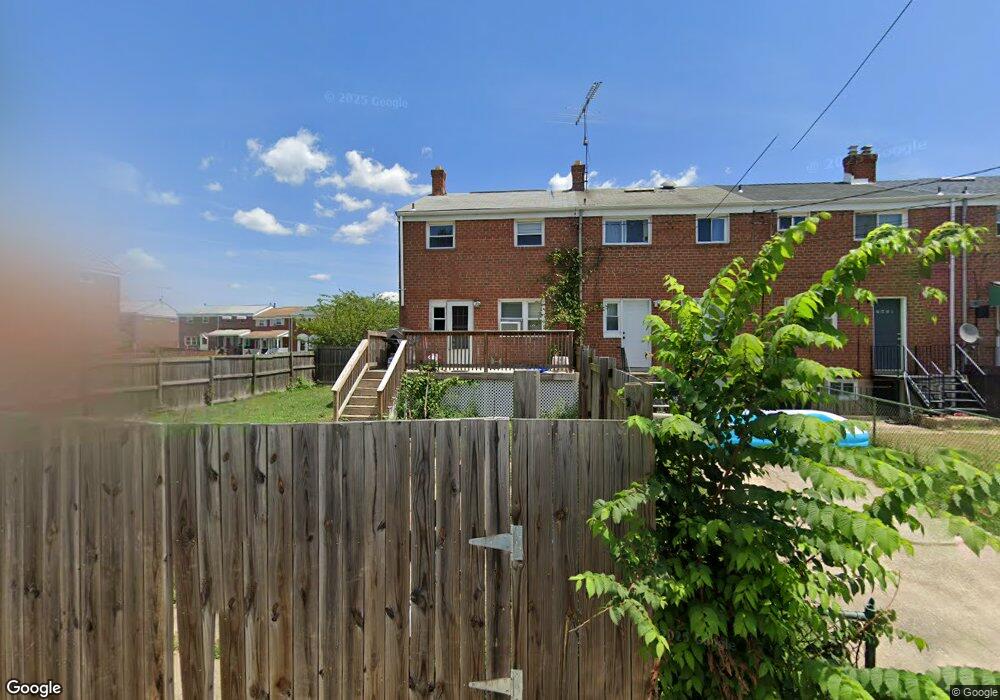
7647 Charlesmont Rd Dundalk, MD 21222
Estimated Value: $220,719 - $244,000
3
Beds
1
Bath
1,008
Sq Ft
$227/Sq Ft
Est. Value
About This Home
This home is located at 7647 Charlesmont Rd, Dundalk, MD 21222 and is currently estimated at $228,680, approximately $226 per square foot. 7647 Charlesmont Rd is a home located in Baltimore County with nearby schools including Charlesmont Elementary, General John Stricker Middle School, and Patapsco High & Center for Arts.
Ownership History
Date
Name
Owned For
Owner Type
Purchase Details
Closed on
Jun 26, 2012
Sold by
Curran Patrick
Bought by
Lichtenberg Lindsay M
Current Estimated Value
Purchase Details
Closed on
Oct 14, 2011
Sold by
Smith Donald and Smith Norah
Bought by
Curran Patricia
Purchase Details
Closed on
Aug 22, 2008
Sold by
Schneider Brian
Bought by
Smith Donald and Smith Norah
Purchase Details
Closed on
Aug 18, 2008
Sold by
Schneider Brian
Bought by
Smith Donald and Smith Norah
Purchase Details
Closed on
May 6, 2005
Sold by
Mcglone Timothy W H
Bought by
Schneider Brian and Schonbachler Heather E
Home Financials for this Owner
Home Financials are based on the most recent Mortgage that was taken out on this home.
Original Mortgage
$102,800
Interest Rate
5.78%
Mortgage Type
New Conventional
Purchase Details
Closed on
Dec 8, 1999
Sold by
Mcglone Timothy W H
Bought by
Mcglone Timothy W H
Create a Home Valuation Report for This Property
The Home Valuation Report is an in-depth analysis detailing your home's value as well as a comparison with similar homes in the area
Home Values in the Area
Average Home Value in this Area
Purchase History
| Date | Buyer | Sale Price | Title Company |
|---|---|---|---|
| Lichtenberg Lindsay M | $125,000 | -- | |
| Curran Patricia | $62,080 | Sage Title Group Llc | |
| Smith Donald | $192,000 | -- | |
| Smith Donald | $192,000 | -- | |
| Schneider Brian | $128,500 | -- | |
| Mcglone Timothy W H | -- | -- |
Source: Public Records
Mortgage History
| Date | Status | Borrower | Loan Amount |
|---|---|---|---|
| Previous Owner | Schneider Brian | $102,800 | |
| Previous Owner | Schneider Brian | $20,560 |
Source: Public Records
Tax History Compared to Growth
Tax History
| Year | Tax Paid | Tax Assessment Tax Assessment Total Assessment is a certain percentage of the fair market value that is determined by local assessors to be the total taxable value of land and additions on the property. | Land | Improvement |
|---|---|---|---|---|
| 2025 | $3,206 | $172,667 | -- | -- |
| 2024 | $3,206 | $157,333 | $0 | $0 |
| 2023 | $2,576 | $142,000 | $40,000 | $102,000 |
| 2022 | $2,436 | $140,100 | $0 | $0 |
| 2021 | $2,338 | $138,200 | $0 | $0 |
| 2020 | $2,338 | $136,300 | $40,000 | $96,300 |
| 2019 | $2,224 | $135,233 | $0 | $0 |
| 2018 | $0 | $134,167 | $0 | $0 |
| 2017 | $2,132 | $133,100 | $0 | $0 |
| 2016 | $2,701 | $129,533 | $0 | $0 |
| 2015 | $2,701 | $125,967 | $0 | $0 |
| 2014 | $2,701 | $122,400 | $0 | $0 |
Source: Public Records
Map
Nearby Homes
- 3323 Wallford Dr
- 7611 Charlesmont Rd
- 3315 Wallford Dr
- 3308 Wallford Dr
- 3426 Wallford Dr
- 7808 Deboy Ave
- 3707 N Point Rd
- 8046 Wallace Rd
- 8169 Park Haven Rd
- 8127 Park Haven Rd
- 8146 Gray Haven Rd
- 8144 Gray Haven Rd
- 8173 Gray Haven Rd
- 8103 Gray Haven Rd
- 8032 Gray Haven Rd
- 8123 Mid Haven Rd
- 7656 Old Battle Grove Rd
- 8110 N Boundary Rd
- 215 Pinewood Rd
- 1704 Melbourne Rd
- 7649 Charlesmont Rd
- 7651 Charlesmont Rd
- 7645 Charlesmont Rd
- 7653 Charlesmont Rd
- 7655 Charlesmont Rd
- 7643 Charlesmont Rd
- 7657 Charlesmont Rd
- 7641 Charlesmont Rd
- 7659 Charlesmont Rd
- 7639 Charlesmont Rd
- 7800 Jamesford Rd
- 7637 Charlesmont Rd
- 7802 Jamesford Rd
- 7703 Charlesmont Rd
- 7804 Jamesford Rd
- 7635 Charlesmont Rd
- 7646 Charlesmont Rd
- 7705 Charlesmont Rd
- 7644 Charlesmont Rd
- 7806 Jamesford Rd