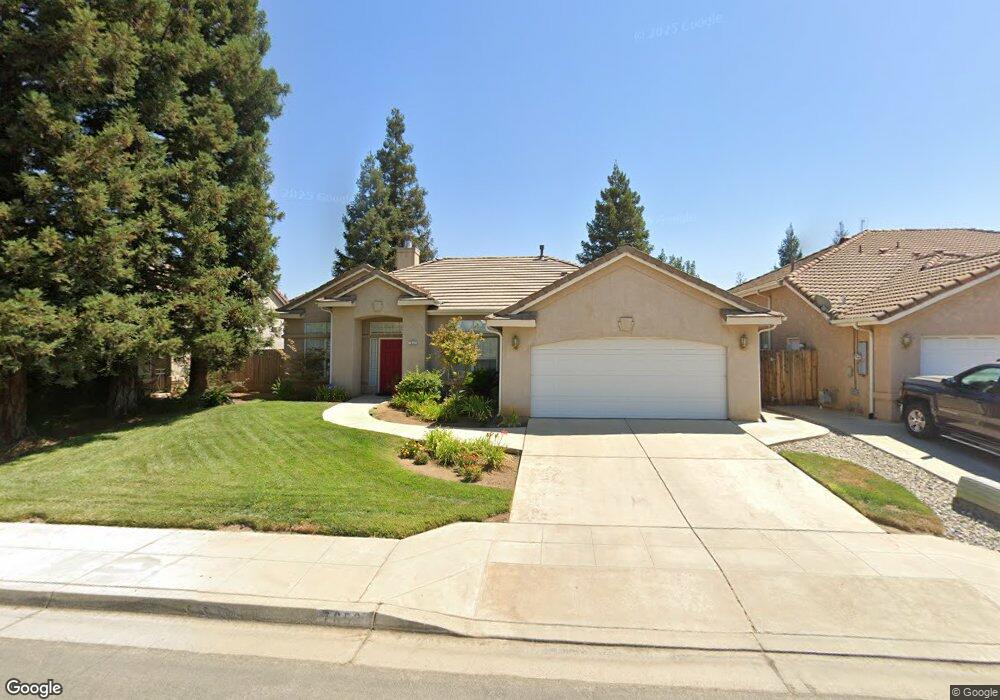
7652 N Carnegie Ave Fresno, CA 93722
Sierra Sky Park NeighborhoodEstimated Value: $420,000 - $453,000
3
Beds
3
Baths
1,594
Sq Ft
$271/Sq Ft
Est. Value
About This Home
This home is located at 7652 N Carnegie Ave, Fresno, CA 93722 and is currently estimated at $432,079, approximately $271 per square foot. 7652 N Carnegie Ave is a home located in Fresno County with nearby schools including Norman Liddell Elementary and Rio Vista Middle School.
Ownership History
Date
Name
Owned For
Owner Type
Purchase Details
Closed on
Sep 26, 2000
Sold by
Va
Bought by
Sacca Sam and Sacca Ellen M
Current Estimated Value
Home Financials for this Owner
Home Financials are based on the most recent Mortgage that was taken out on this home.
Original Mortgage
$99,000
Interest Rate
7%
Purchase Details
Closed on
Jul 12, 2000
Sold by
Ba Mtg Llc
Bought by
Va
Purchase Details
Closed on
Jun 30, 2000
Sold by
Goates Darryl D and Goates Rita J
Bought by
Ba Mtg Llc
Purchase Details
Closed on
Jun 2, 1997
Sold by
Leo Wilson Co Inc
Bought by
Goates Darryl D and Goates Rita J
Home Financials for this Owner
Home Financials are based on the most recent Mortgage that was taken out on this home.
Original Mortgage
$129,030
Interest Rate
7.98%
Mortgage Type
VA
Create a Home Valuation Report for This Property
The Home Valuation Report is an in-depth analysis detailing your home's value as well as a comparison with similar homes in the area
Home Values in the Area
Average Home Value in this Area
Purchase History
| Date | Buyer | Sale Price | Title Company |
|---|---|---|---|
| Sacca Sam | $124,000 | Chicago Title Co | |
| Va | -- | First American Title Ins Co | |
| Ba Mtg Llc | $108,400 | First American Title Ins Co | |
| Goates Darryl D | $127,000 | Central Title Company |
Source: Public Records
Mortgage History
| Date | Status | Borrower | Loan Amount |
|---|---|---|---|
| Previous Owner | Sacca Sam | $99,000 | |
| Previous Owner | Goates Darryl D | $129,030 |
Source: Public Records
Tax History Compared to Growth
Tax History
| Year | Tax Paid | Tax Assessment Tax Assessment Total Assessment is a certain percentage of the fair market value that is determined by local assessors to be the total taxable value of land and additions on the property. | Land | Improvement |
|---|---|---|---|---|
| 2025 | $2,395 | $185,317 | $60,260 | $125,057 |
| 2023 | $2,339 | $178,122 | $57,921 | $120,201 |
| 2022 | $2,210 | $174,631 | $56,786 | $117,845 |
| 2021 | $2,227 | $171,208 | $55,673 | $115,535 |
| 2020 | $2,120 | $169,454 | $55,103 | $114,351 |
| 2019 | $2,088 | $166,132 | $54,023 | $112,109 |
| 2018 | $2,042 | $162,875 | $52,964 | $109,911 |
| 2017 | $2,049 | $159,682 | $51,926 | $107,756 |
| 2016 | $1,892 | $156,552 | $50,908 | $105,644 |
| 2015 | $1,884 | $154,202 | $50,144 | $104,058 |
| 2014 | $1,884 | $151,182 | $49,162 | $102,020 |
Source: Public Records
Map
Nearby Homes
- 5811 W Cromwell Ave
- 5779 W Bluff Ave
- 7568 N Hanna Ave
- 7526 N Ellendale Ave
- 5804 W Chennault Ave
- 5313 W King Fisher Ln
- 7731 N Barcus Ave
- 6001 W Alluvial Ave
- 7195 N Carnegie Ave
- 5094 W Cromwell Ave
- 5136 W Bluff Ave
- 5838 W Fallon Ave
- 7752 N Gilroy Ave
- 4968 W Pinedale Ave
- 4918 W Bluff Ave
- 6203 W Chennault Ave
- 5049 W Locust Ave
- 5989 W Turtle Bay Dr
- 5802 W Millbrae Ave
- 6675 N Lola Ave
- 7664 N Carnegie Ave
- 7640 N Carnegie Ave
- 7653 N Ivanhoe Ave
- 7665 N Ivanhoe Ave
- 7676 N Carnegie Ave
- 7628 N Carnegie Ave
- 7641 N Ivanhoe Ave
- 5842 W Bedford Ave
- 7649 N Carnegie Ave
- 7661 N Carnegie Ave
- 7629 N Ivanhoe Ave
- 7677 N Ivanhoe Ave
- 7637 N Carnegie Ave
- 7684 N Carnegie Ave
- 7616 N Carnegie Ave
- 7673 N Carnegie Ave
- 7625 N Carnegie Ave
- 7617 N Ivanhoe Ave
- 7685 N Carnegie Ave
- 5628 W Cromwell Ave