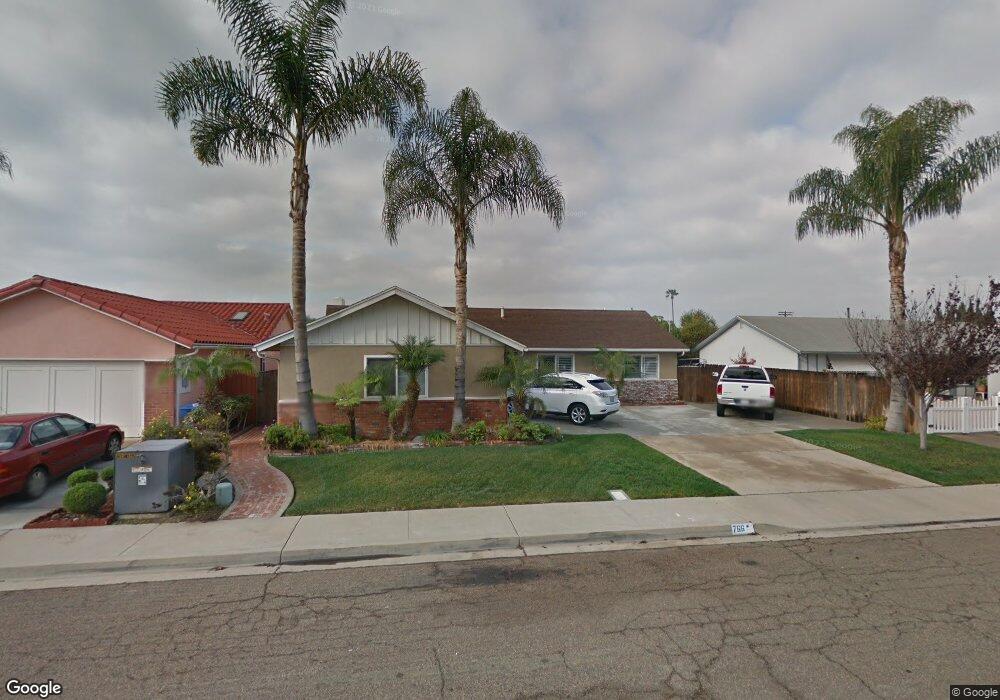
766 Guava Ave Chula Vista, CA 91910
Downtown Chula Vista NeighborhoodEstimated Value: $794,634 - $832,000
3
Beds
2
Baths
1,585
Sq Ft
$517/Sq Ft
Est. Value
About This Home
This home is located at 766 Guava Ave, Chula Vista, CA 91910 and is currently estimated at $819,659, approximately $517 per square foot. 766 Guava Ave is a home located in San Diego County with nearby schools including Lilian J. Rice Elementary School, Chula Vista Middle School, and Chula Vista High School.
Ownership History
Date
Name
Owned For
Owner Type
Purchase Details
Closed on
May 17, 2000
Sold by
Rathburn Marshall C
Bought by
Filson Robert M and Santos Annabella N
Current Estimated Value
Home Financials for this Owner
Home Financials are based on the most recent Mortgage that was taken out on this home.
Original Mortgage
$201,850
Interest Rate
8.27%
Create a Home Valuation Report for This Property
The Home Valuation Report is an in-depth analysis detailing your home's value as well as a comparison with similar homes in the area
Home Values in the Area
Average Home Value in this Area
Purchase History
| Date | Buyer | Sale Price | Title Company |
|---|---|---|---|
| Filson Robert M | $212,500 | Fidelity National Title Co |
Source: Public Records
Mortgage History
| Date | Status | Borrower | Loan Amount |
|---|---|---|---|
| Previous Owner | Filson Robert M | $201,850 |
Source: Public Records
Tax History Compared to Growth
Tax History
| Year | Tax Paid | Tax Assessment Tax Assessment Total Assessment is a certain percentage of the fair market value that is determined by local assessors to be the total taxable value of land and additions on the property. | Land | Improvement |
|---|---|---|---|---|
| 2025 | $3,695 | $326,580 | $155,513 | $171,067 |
| 2024 | $3,695 | $320,177 | $152,464 | $167,713 |
| 2023 | $3,643 | $313,900 | $149,475 | $164,425 |
| 2022 | $3,537 | $307,746 | $146,545 | $161,201 |
| 2021 | $3,454 | $301,713 | $143,672 | $158,041 |
| 2020 | $3,371 | $298,620 | $142,199 | $156,421 |
| 2019 | $3,282 | $292,765 | $139,411 | $153,354 |
| 2018 | $3,230 | $287,026 | $136,678 | $150,348 |
| 2017 | $3,161 | $281,399 | $133,999 | $147,400 |
| 2016 | $3,086 | $275,882 | $131,372 | $144,510 |
| 2015 | $3,041 | $271,739 | $129,399 | $142,340 |
| 2014 | $2,989 | $266,417 | $126,865 | $139,552 |
Source: Public Records
Map
Nearby Homes
- 658 Cedar Ave
- 898 Date Ave
- 516 L St
- 580 4th Ave
- 550 L St
- Plan 6 at Citrus Bay - The Towns
- Plan 4 at Citrus Bay - The Towns
- Plan 2 at Citrus Bay - The Towns
- Plan 5 at Citrus Bay - The Towns
- Plan 3 at Citrus Bay - The Towns
- Plan 1 at Citrus Bay - The Towns
- 479 Arizona St
- Plan1 at Citrus Bay - The Courts
- Plan 2 at Citrus Bay - The Courts
- Plan 3 at Citrus Bay - The Courts
- 383 Mankato St Unit 6
- 766 Madison Ave Unit A B
- 786 Madison Ave
- 685 Jefferson Ave
- 622 I St