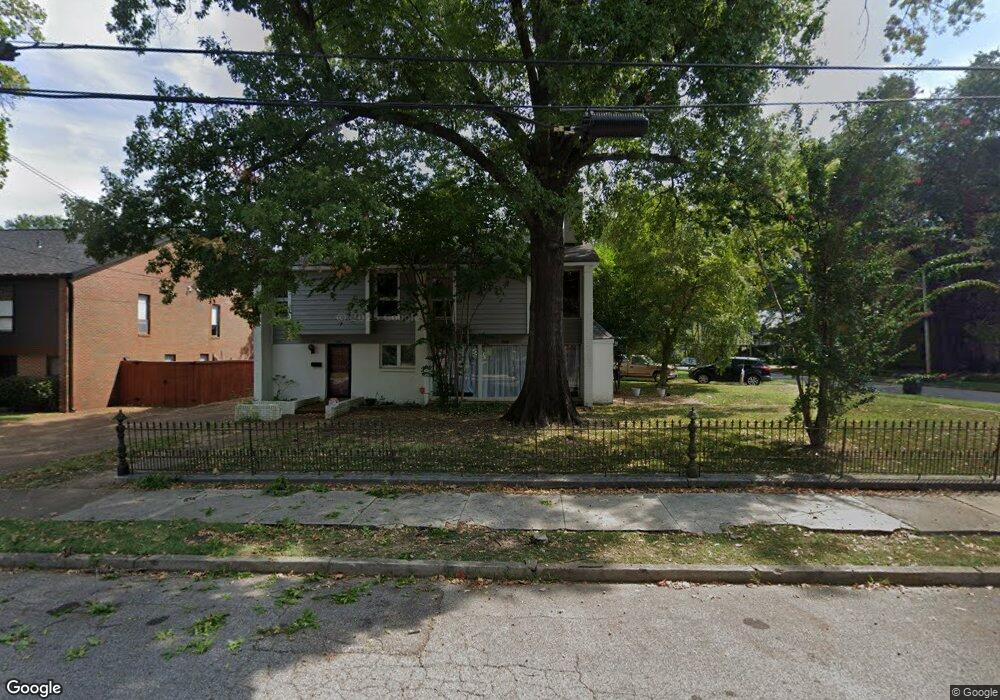
766 Roland St Memphis, TN 38104
Central Gardens NeighborhoodEstimated Value: $420,000 - $494,688
2
Beds
3
Baths
3,196
Sq Ft
$144/Sq Ft
Est. Value
About This Home
This home is located at 766 Roland St, Memphis, TN 38104 and is currently estimated at $459,172, approximately $143 per square foot. 766 Roland St is a home located in Shelby County with nearby schools including Bruce Elementary School, Bellevue Middle School, and Central High School.
Ownership History
Date
Name
Owned For
Owner Type
Purchase Details
Closed on
Jul 22, 2021
Sold by
Naylor Derek and Naylor Jaime
Bought by
Lieblong Carrie and Roeder Micah
Current Estimated Value
Home Financials for this Owner
Home Financials are based on the most recent Mortgage that was taken out on this home.
Original Mortgage
$306,000
Outstanding Balance
$277,775
Interest Rate
2.93%
Mortgage Type
New Conventional
Estimated Equity
$181,397
Purchase Details
Closed on
Dec 22, 2016
Sold by
Kahn Rahat
Bought by
Naylor Derek and Naylor Jamie
Home Financials for this Owner
Home Financials are based on the most recent Mortgage that was taken out on this home.
Original Mortgage
$204,000
Interest Rate
4.08%
Mortgage Type
Commercial
Purchase Details
Closed on
Dec 20, 2004
Sold by
Langston Dudley and Langston Ann Wooten
Bought by
Khan Rahat
Home Financials for this Owner
Home Financials are based on the most recent Mortgage that was taken out on this home.
Original Mortgage
$177,600
Interest Rate
5.63%
Mortgage Type
Purchase Money Mortgage
Create a Home Valuation Report for This Property
The Home Valuation Report is an in-depth analysis detailing your home's value as well as a comparison with similar homes in the area
Home Values in the Area
Average Home Value in this Area
Purchase History
| Date | Buyer | Sale Price | Title Company |
|---|---|---|---|
| Lieblong Carrie | $360,000 | Executive Ttl & Closing Inc | |
| Naylor Derek | $240,000 | Chicago Title | |
| Khan Rahat | $222,000 | -- |
Source: Public Records
Mortgage History
| Date | Status | Borrower | Loan Amount |
|---|---|---|---|
| Open | Lieblong Carrie | $306,000 | |
| Previous Owner | Naylor Derek | $204,000 | |
| Previous Owner | Khan Rahat | $177,600 | |
| Closed | Khan Rahat | $22,200 |
Source: Public Records
Tax History Compared to Growth
Tax History
| Year | Tax Paid | Tax Assessment Tax Assessment Total Assessment is a certain percentage of the fair market value that is determined by local assessors to be the total taxable value of land and additions on the property. | Land | Improvement |
|---|---|---|---|---|
| 2025 | $3,611 | $177,760 | $35,880 | $141,880 |
| 2024 | $3,611 | $106,520 | $26,640 | $79,880 |
| 2023 | $6,489 | $106,520 | $26,640 | $79,880 |
| 2022 | $6,489 | $106,520 | $26,640 | $79,880 |
| 2021 | $3,675 | $106,520 | $26,640 | $79,880 |
| 2020 | $6,736 | $92,960 | $26,640 | $66,320 |
| 2019 | $2,971 | $92,960 | $26,640 | $66,320 |
| 2018 | $2,971 | $92,960 | $26,640 | $66,320 |
| 2017 | $3,041 | $92,960 | $26,640 | $66,320 |
| 2016 | $3,440 | $78,720 | $0 | $0 |
| 2014 | $3,440 | $78,720 | $0 | $0 |
Source: Public Records
Map
Nearby Homes
- 793 Rozelle St
- 1685 York Ave
- 1647 Nelson Ave
- 1653 Nelson Ave
- 1743 York Ave
- 697 S Belvedere Blvd Unit B
- 1630 E Clanlo Dr
- 674 St Augustine Dr Unit D
- 700 St Augustine
- 1680 Euclid Ave
- 1732 Nelson Ave
- 1692 Euclid Ave
- 1606 Goodbar Ave
- 1778 Evelyn Ave
- 1520 Central Ave
- 690 Rosemary Ln
- 1631 Harbert Ave
- 1763 Glenwood Place
- 1793 Evelyn Ave
- 1772 Euclid Ave
- 762 Roland St
- 760 Roland St Unit 762
- 760 Roland St Unit 1
- 1622 York Ave
- 1599 York Ave
- 1634 York Ave
- 750 Roland St Unit 750
- 757 Roland St
- 1597 York Ave
- 1615 York Ave
- 1621 York Ave
- 1640 York Ave
- 751 Roland St
- 1593 York Ave
- 773 Roland St
- 1637 York Ave
- 1591 York Ave
- 1644 York Ave
- 775 Roland St
- 748 Roland St Unit 748