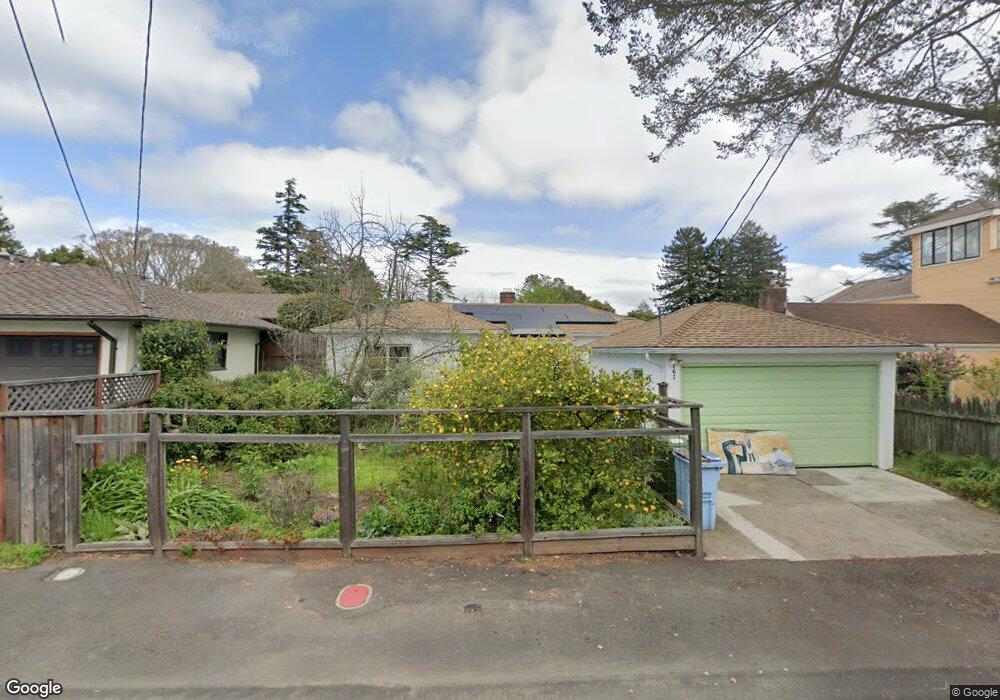
767 Creston Rd Berkeley, CA 94708
Berkeley Hills NeighborhoodEstimated Value: $1,259,000 - $1,355,000
2
Beds
1
Bath
1,386
Sq Ft
$947/Sq Ft
Est. Value
About This Home
This home is located at 767 Creston Rd, Berkeley, CA 94708 and is currently estimated at $1,312,754, approximately $947 per square foot. 767 Creston Rd is a home located in Alameda County with nearby schools including Cragmont Elementary School, Berkeley Arts Magnet at Whittier School, and Washington Elementary School.
Ownership History
Date
Name
Owned For
Owner Type
Purchase Details
Closed on
May 14, 2016
Sold by
Evensen Lesley S and Mueller Michael Kelly
Bought by
Evensen Mueller Revocable Living Trust
Current Estimated Value
Purchase Details
Closed on
Nov 24, 1999
Sold by
Evensen Lesley S
Bought by
Evensen Michael Kelly and Evensen Lesley S
Home Financials for this Owner
Home Financials are based on the most recent Mortgage that was taken out on this home.
Original Mortgage
$267,000
Interest Rate
7.95%
Purchase Details
Closed on
Jun 24, 1998
Sold by
Guy Thalia Polos and Guy Harriette
Bought by
Evensen Lesley S
Home Financials for this Owner
Home Financials are based on the most recent Mortgage that was taken out on this home.
Original Mortgage
$268,000
Interest Rate
7.62%
Create a Home Valuation Report for This Property
The Home Valuation Report is an in-depth analysis detailing your home's value as well as a comparison with similar homes in the area
Home Values in the Area
Average Home Value in this Area
Purchase History
| Date | Buyer | Sale Price | Title Company |
|---|---|---|---|
| Evensen Mueller Revocable Living Trust | -- | None Available | |
| Evensen Lesley S | -- | None Available | |
| Evensen Michael Kelly | -- | Old Republic Title Company | |
| Evensen Lesley S | -- | Placer Title Company |
Source: Public Records
Mortgage History
| Date | Status | Borrower | Loan Amount |
|---|---|---|---|
| Closed | Evensen Michael Kelly | $267,000 | |
| Closed | Evensen Lesley S | $268,000 |
Source: Public Records
Tax History
| Year | Tax Paid | Tax Assessment Tax Assessment Total Assessment is a certain percentage of the fair market value that is determined by local assessors to be the total taxable value of land and additions on the property. | Land | Improvement |
|---|---|---|---|---|
| 2025 | $9,201 | $518,151 | $157,545 | $367,606 |
| 2024 | $9,201 | $507,857 | $154,457 | $360,400 |
| 2023 | $8,976 | $504,764 | $151,429 | $353,335 |
| 2022 | $8,571 | $487,868 | $148,460 | $346,408 |
| 2021 | $8,576 | $478,166 | $145,550 | $339,616 |
| 2020 | $8,099 | $480,191 | $144,057 | $336,134 |
| 2019 | $7,755 | $470,778 | $141,233 | $329,545 |
| 2018 | $7,611 | $461,548 | $138,464 | $323,084 |
| 2017 | $7,324 | $452,500 | $135,750 | $316,750 |
| 2016 | $7,063 | $443,630 | $133,089 | $310,541 |
| 2015 | $6,960 | $436,967 | $131,090 | $305,877 |
| 2014 | $6,848 | $428,407 | $128,522 | $299,885 |
Source: Public Records
Map
Nearby Homes
- 731 Grizzly Peak Blvd
- 890 Keeler Ave
- 935 Grizzly Peak Blvd
- 982 Grizzly Peak Blvd
- 614 Cragmont Ave
- 758 Spruce St
- 1024 Grizzly Peak Blvd
- 1024 Miller Ave
- 962 Regal Rd
- 770 Santa Barbara Rd
- 410 Grizzly Peak Blvd
- 813 San Diego Rd
- 1040 Park Hills Rd
- 826 Indian Rock Ave
- 765 San Diego Rd
- 1100 Miller Ave
- 1106 Cragmont Ave
- 483 Boynton Ave
- 1119 Miller Ave
- 589 San Luis Rd
- 759 Creston Rd
- 769 Creston Rd
- 755 Creston Rd
- 678 Woodmont Ave
- 766 Creston Rd
- 762 Creston Rd
- 770 Creston Rd
- 775 Creston Rd
- 756 Creston Rd
- 776 Creston Rd
- 747 Creston Rd
- 750 Creston Rd
- 779 Creston Rd
- 672 Woodmont Ave
- 780 Creston Rd
- 677 Woodmont Ave
- 681 Woodmont Ave
- 673 Woodmont Ave
- 765 Grizzly Peak Blvd
- 771 Grizzly Peak Blvd
Your Personal Tour Guide
Ask me questions while you tour the home.