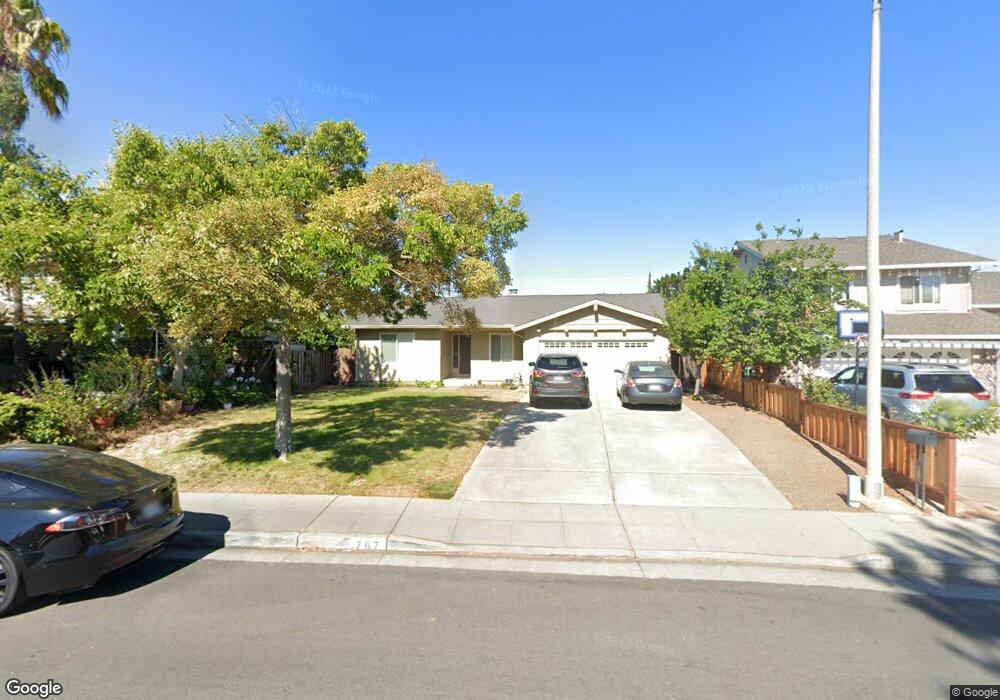
767 Mahogany Ln Sunnyvale, CA 94086
Ponderosa Park NeighborhoodEstimated Value: $2,587,000 - $2,991,000
4
Beds
2
Baths
1,828
Sq Ft
$1,480/Sq Ft
Est. Value
About This Home
This home is located at 767 Mahogany Ln, Sunnyvale, CA 94086 and is currently estimated at $2,706,097, approximately $1,480 per square foot. 767 Mahogany Ln is a home located in Santa Clara County with nearby schools including Ponderosa Elementary School, Marian A. Peterson Middle School, and Adrian Wilcox High School.
Ownership History
Date
Name
Owned For
Owner Type
Purchase Details
Closed on
Nov 15, 2011
Sold by
Burgi Dean S
Bought by
Herrera Matthew C and Gackstetter Teri R
Current Estimated Value
Home Financials for this Owner
Home Financials are based on the most recent Mortgage that was taken out on this home.
Original Mortgage
$580,000
Outstanding Balance
$396,267
Interest Rate
4.06%
Mortgage Type
New Conventional
Estimated Equity
$2,309,830
Purchase Details
Closed on
Apr 23, 2010
Sold by
Burgi Margaret B
Bought by
Burgi Dean S
Purchase Details
Closed on
Jun 22, 2000
Sold by
Martino Phillip And Claudia Trustee
Bought by
Burgi Dean S and Burgi Margaret B
Home Financials for this Owner
Home Financials are based on the most recent Mortgage that was taken out on this home.
Original Mortgage
$460,000
Interest Rate
8.37%
Create a Home Valuation Report for This Property
The Home Valuation Report is an in-depth analysis detailing your home's value as well as a comparison with similar homes in the area
Home Values in the Area
Average Home Value in this Area
Purchase History
| Date | Buyer | Sale Price | Title Company |
|---|---|---|---|
| Herrera Matthew C | $725,000 | Chicago Title Company | |
| Burgi Dean S | -- | None Available | |
| Burgi Dean S | $575,000 | First American Title Guarant |
Source: Public Records
Mortgage History
| Date | Status | Borrower | Loan Amount |
|---|---|---|---|
| Open | Herrera Matthew C | $580,000 | |
| Previous Owner | Burgi Dean S | $460,000 | |
| Closed | Burgi Dean S | $57,500 |
Source: Public Records
Tax History
| Year | Tax Paid | Tax Assessment Tax Assessment Total Assessment is a certain percentage of the fair market value that is determined by local assessors to be the total taxable value of land and additions on the property. | Land | Improvement |
|---|---|---|---|---|
| 2025 | $10,407 | $910,628 | $682,911 | $227,717 |
| 2024 | $10,407 | $892,773 | $669,521 | $223,252 |
| 2023 | $10,299 | $875,269 | $656,394 | $218,875 |
| 2022 | $10,126 | $858,108 | $643,524 | $214,584 |
| 2021 | $10,086 | $841,283 | $630,906 | $210,377 |
| 2020 | $9,902 | $832,657 | $624,437 | $208,220 |
| 2019 | $9,888 | $816,332 | $612,194 | $204,138 |
| 2018 | $9,251 | $800,327 | $600,191 | $200,136 |
| 2017 | $9,197 | $784,635 | $588,423 | $196,212 |
| 2016 | $8,999 | $769,251 | $576,886 | $192,365 |
| 2015 | $8,965 | $757,697 | $568,221 | $189,476 |
| 2014 | $8,535 | $742,856 | $557,091 | $185,765 |
Source: Public Records
Map
Nearby Homes
- 108 Koa Ct
- 869 Lusterleaf Dr
- 949 Aster Ct
- 247 Peppermint Tree Terrace Unit 5
- 504 Hawthorn Ave
- 663 Smoke Tree Way
- 744 Jackpine Ct
- 236 Red Oak Dr E Unit B
- 225 Red Oak Dr W Unit H
- 769 E Evelyn Ave
- 759 E Evelyn Ave
- 710 Henderson Ave
- 157 Jeffrey Terrace
- 922 Noble Fir Terrace Unit 1
- 951 S Wolfe Rd
- 889 Rattan Terrace
- 618 S Fair Oaks Ave Unit 46
- 626 S Fair Oaks Ave
- 129 Paperbark Terrace
- 156 Incense Terrace
- 769 Mahogany Ln
- 765 Mahogany Ln
- 771 Mahogany Ln
- 763 Mahogany Ln
- 768 S Wolfe Rd
- 764 Mahogany Ln
- 773 Mahogany Ln
- 761 Mahogany Ln
- 762 Mahogany Ln
- 897 Firethorn Terrace
- 778 S Wolfe Rd
- 768 Mahogany Ln
- 775 Mahogany Ln
- 895 Firethorn Terrace
- 767 S Wolfe Rd
- 760 Mahogany Ln
- 759 Mahogany Ln
- 770 Mahogany Ln
- 898 Firethorn Terrace
- 929 Mesa Oak Ct
Your Personal Tour Guide
Ask me questions while you tour the home.