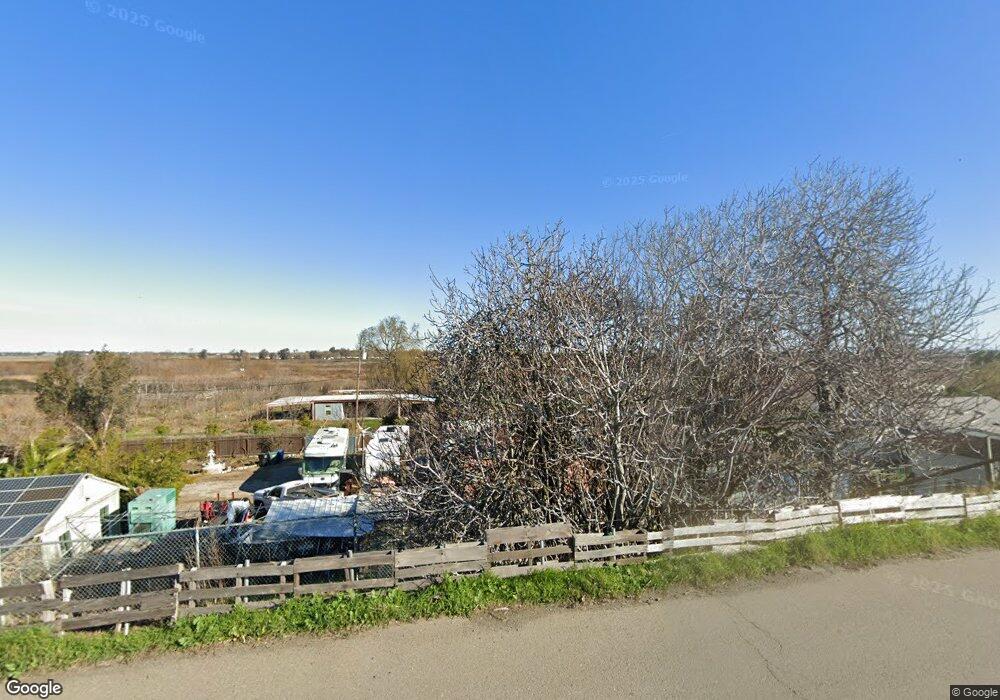
767 W Brannan Island Rd Isleton, CA 95641
Estimated Value: $158,000 - $517,000
--
Bed
2
Baths
--
Sq Ft
9,932
Sq Ft Lot
About This Home
This home is located at 767 W Brannan Island Rd, Isleton, CA 95641 and is currently estimated at $346,000. 767 W Brannan Island Rd is a home located in Sacramento County with nearby schools including Isleton Elementary School, Riverview Middle School, and Rio Vista High School.
Ownership History
Date
Name
Owned For
Owner Type
Purchase Details
Closed on
Oct 17, 2018
Sold by
Tinker Christopher
Bought by
Watts Jaime and Lester Michael
Current Estimated Value
Home Financials for this Owner
Home Financials are based on the most recent Mortgage that was taken out on this home.
Original Mortgage
$427,121
Outstanding Balance
$372,475
Interest Rate
4.5%
Mortgage Type
FHA
Estimated Equity
-$26,475
Purchase Details
Closed on
Sep 6, 2012
Sold by
Koga Cindy and Estate Of Teresa Burnette
Bought by
Tinker Christopher
Home Financials for this Owner
Home Financials are based on the most recent Mortgage that was taken out on this home.
Original Mortgage
$93,000
Interest Rate
3.55%
Mortgage Type
Seller Take Back
Purchase Details
Closed on
Oct 12, 2007
Sold by
Koga Cindy
Bought by
Koga Cindy
Purchase Details
Closed on
Aug 22, 1996
Sold by
Burnett Dorothy
Bought by
Burnett Dorothy Ann
Create a Home Valuation Report for This Property
The Home Valuation Report is an in-depth analysis detailing your home's value as well as a comparison with similar homes in the area
Home Values in the Area
Average Home Value in this Area
Purchase History
| Date | Buyer | Sale Price | Title Company |
|---|---|---|---|
| Watts Jaime | $435,000 | Old Republic Title Company | |
| Tinker Christopher | $108,000 | Placer Title Company | |
| Koga Cindy | -- | None Available | |
| Burnett Dorothy Ann | -- | -- |
Source: Public Records
Mortgage History
| Date | Status | Borrower | Loan Amount |
|---|---|---|---|
| Open | Watts Jaime | $427,121 | |
| Previous Owner | Tinker Christopher | $93,000 |
Source: Public Records
Tax History Compared to Growth
Tax History
| Year | Tax Paid | Tax Assessment Tax Assessment Total Assessment is a certain percentage of the fair market value that is determined by local assessors to be the total taxable value of land and additions on the property. | Land | Improvement |
|---|---|---|---|---|
| 2025 | $1,303 | $94,816 | $94,816 | -- |
| 2024 | $1,303 | $92,957 | $92,957 | -- |
| 2023 | $1,287 | $91,135 | $91,135 | $0 |
| 2022 | $1,266 | $89,349 | $89,349 | $0 |
| 2021 | $1,139 | $87,598 | $87,598 | $0 |
| 2020 | $1,097 | $86,700 | $86,700 | $0 |
| 2019 | $1,060 | $85,000 | $85,000 | $0 |
| 2018 | $446 | $23,806 | $23,806 | $0 |
| 2017 | $347 | $23,340 | $23,340 | $0 |
| 2016 | $342 | $22,883 | $22,883 | $0 |
| 2015 | $341 | $22,540 | $22,540 | $0 |
| 2014 | $337 | $22,099 | $22,099 | $0 |
Source: Public Records
Map
Nearby Homes
- 841 W Brannan Island Rd Unit 1
- 841 W Brannan Island Rd Unit 5
- 841 W Brannan Island Rd Unit 3
- 659 W Brannan Island Rd
- 395 Brannan Island Rd Unit 27
- 525-575 Brannan Island Rd
- 17035 Terminous Rd
- 707 Joseph Place
- 0 Terminous Rd Unit ML82008954
- 195 Oxbow Marina Dr
- 16637 Tyler Island Rd
- 00 Brannan Isle Rd
- 10 School St
- 0 6th St
- 0 6th St
- 104 4th St
- 209 4th St
- 0 Jackson Blvd Unit 225101313
- 301 B St
- 608 Union St
- 763 W Brannan Island Rd
- 763 W Brannan Island Rd
- 757 W Brannan Island Rd
- 777 W Brannan Island Rd
- 755 W Brannan Island Rd
- 747 W Brannan Island Rd
- 743 W Brannan Island Rd
- 731 W Brannan Island Rd
- 2 Brannan Island Rd
- 841 W Brannam Island Rd Unit 35
- 841 W Brannan Island Rd Unit 35
- 841 W Brannan Island Rd Unit 41
- 841 W Brannan Island Rd Unit 2
- 841 W Brannan Island Rd Unit 42
- 841 W Brannan Island Rd Unit 20
- 841 W Brannan Island Rd Unit 40
- 841 W Brannan Island Rd Unit 31
- 841 W Brannan Island Rd Unit 11
- 841 W Brannan Island Rd Unit 34