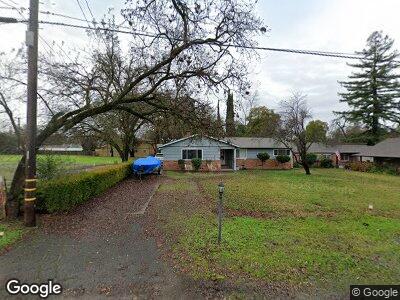
7672 Watson Way Citrus Heights, CA 95610
Sunrise Ranch NeighborhoodEstimated Value: $498,000 - $582,000
3
Beds
2
Baths
1,474
Sq Ft
$358/Sq Ft
Est. Value
About This Home
This home is located at 7672 Watson Way, Citrus Heights, CA 95610 and is currently estimated at $528,340, approximately $358 per square foot. 7672 Watson Way is a home located in Sacramento County with nearby schools including Mariposa Avenue Elementary School, Sylvan Middle School, and Mesa Verde High School.
Ownership History
Date
Name
Owned For
Owner Type
Purchase Details
Closed on
Oct 29, 2001
Sold by
Ranelli Laurena L
Bought by
Johnston Sandra M and Laurena L Ranelli Trust
Current Estimated Value
Home Financials for this Owner
Home Financials are based on the most recent Mortgage that was taken out on this home.
Original Mortgage
$200,940
Interest Rate
6.67%
Mortgage Type
VA
Purchase Details
Closed on
Oct 22, 2001
Sold by
Irrevocable Johnston Sandra M and Irrevocable Laurena L Ranelli
Bought by
Thompson Robert E and Woods Tonya M
Home Financials for this Owner
Home Financials are based on the most recent Mortgage that was taken out on this home.
Original Mortgage
$200,940
Interest Rate
6.67%
Mortgage Type
VA
Purchase Details
Closed on
Oct 23, 2000
Sold by
Trust Samuel J & Laurena L Ranelli Family and Ranelli Laurena L
Bought by
Johnston Sandra M and Laurena L Ranelli Trust
Create a Home Valuation Report for This Property
The Home Valuation Report is an in-depth analysis detailing your home's value as well as a comparison with similar homes in the area
Home Values in the Area
Average Home Value in this Area
Purchase History
| Date | Buyer | Sale Price | Title Company |
|---|---|---|---|
| Johnston Sandra M | -- | Placer Title Company | |
| Thompson Robert E | $197,000 | Placer Title Company | |
| Johnston Sandra M | -- | -- |
Source: Public Records
Mortgage History
| Date | Status | Borrower | Loan Amount |
|---|---|---|---|
| Open | Thompson Robert E | $182,000 | |
| Closed | Thompson Robert E | $60,000 | |
| Closed | Thompson Robert E | $203,127 | |
| Previous Owner | Thompson Robert E | $200,940 |
Source: Public Records
Tax History Compared to Growth
Tax History
| Year | Tax Paid | Tax Assessment Tax Assessment Total Assessment is a certain percentage of the fair market value that is determined by local assessors to be the total taxable value of land and additions on the property. | Land | Improvement |
|---|---|---|---|---|
| 2024 | $3,436 | $285,301 | $70,957 | $214,344 |
| 2023 | $3,349 | $279,708 | $69,566 | $210,142 |
| 2022 | $3,247 | $274,224 | $68,202 | $206,022 |
| 2021 | $3,191 | $268,848 | $66,865 | $201,983 |
| 2020 | $3,131 | $266,092 | $66,180 | $199,912 |
| 2019 | $3,066 | $260,876 | $64,883 | $195,993 |
| 2018 | $3,029 | $255,761 | $63,611 | $192,150 |
| 2017 | $2,998 | $250,747 | $62,364 | $188,383 |
| 2016 | $2,799 | $245,832 | $61,142 | $184,690 |
| 2015 | $2,750 | $242,140 | $60,224 | $181,916 |
| 2014 | $2,691 | $237,398 | $59,045 | $178,353 |
Source: Public Records
Map
Nearby Homes
- 7696 Watson Way
- 7915 Antelope Rd
- 7951 Antelope Rd
- 7735 Antelope Rd
- 7825 Clearview Dr
- 7652 Leineke Ln
- 7951 Parmis Ct
- 7554 Cripple Creek Rd
- 7668 Cook Ave
- 7557 Pratt Ave
- 7828 Auburn Blvd
- 7528 Sycamore Dr
- 7904 Auburn Blvd
- 7528 Cedar Dr
- 8142 Patton Ave
- 7667 Oak Grove Ave
- 77194 Lauppe Ln
- 7254 Mariposa Ave
- 8033 Sunrise Blvd
- 7429 Tiara Way
- 7672 Watson Way
- 7668 Watson Way
- 7664 Watson Way
- 7727 Mariposa Ave
- 7681 Watson Way
- 7652 Watson Way
- 7685 Watson Way
- 7677 Watson Way
- 7753 Mariposa Ave
- 7691 Watson Way
- 7681 Reno Ln
- 7671 Reno Ln
- 7699 Watson Way
- 7685 Reno Ln
- 7667 Watson Way
- 7725 Mariposa Ave
- 7801 Mariposa Ave
- 7803 Mariposa Ave
- 7700 Watson Way
- 7636 Watson Way