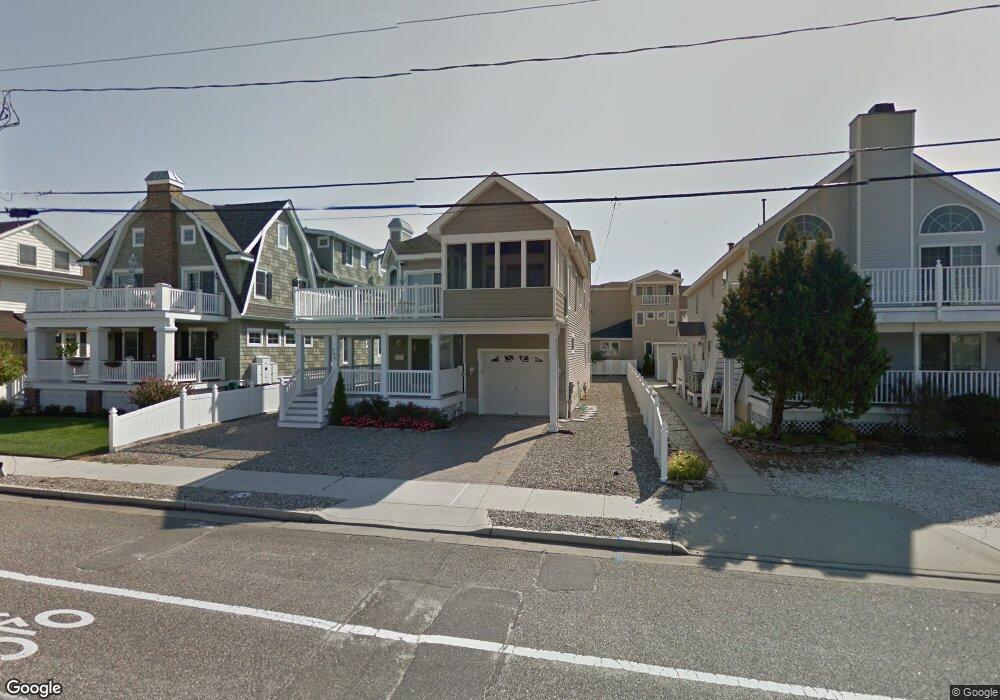
769 Dune Dr Avalon, NJ 08202
Estimated Value: $3,558,995 - $4,610,000
--
Bed
--
Bath
3,209
Sq Ft
$1,257/Sq Ft
Est. Value
About This Home
This home is located at 769 Dune Dr, Avalon, NJ 08202 and is currently estimated at $4,035,249, approximately $1,257 per square foot. 769 Dune Dr is a home located in Cape May County with nearby schools including Avalon Elementary School.
Ownership History
Date
Name
Owned For
Owner Type
Purchase Details
Closed on
Dec 13, 2012
Sold by
Buckley Bruce S and Buckley Sandra L
Bought by
Oliveria Teresa
Current Estimated Value
Purchase Details
Closed on
Sep 23, 2003
Sold by
Phelps Daniel A
Bought by
Kulp Gary M and Kulp Kim L
Home Financials for this Owner
Home Financials are based on the most recent Mortgage that was taken out on this home.
Original Mortgage
$650,000
Interest Rate
6.29%
Purchase Details
Closed on
Aug 16, 2002
Sold by
Hyder Miriam R
Bought by
Phelps Daniel A and Phelps Judith N
Create a Home Valuation Report for This Property
The Home Valuation Report is an in-depth analysis detailing your home's value as well as a comparison with similar homes in the area
Home Values in the Area
Average Home Value in this Area
Purchase History
| Date | Buyer | Sale Price | Title Company |
|---|---|---|---|
| Oliveria Teresa | $375,000 | Seaboard Title Agency | |
| Kulp Gary M | $1,350,000 | -- | |
| Phelps Daniel A | $500,000 | -- |
Source: Public Records
Mortgage History
| Date | Status | Borrower | Loan Amount |
|---|---|---|---|
| Previous Owner | Kulp Gary M | $650,000 |
Source: Public Records
Tax History Compared to Growth
Tax History
| Year | Tax Paid | Tax Assessment Tax Assessment Total Assessment is a certain percentage of the fair market value that is determined by local assessors to be the total taxable value of land and additions on the property. | Land | Improvement |
|---|---|---|---|---|
| 2025 | $10,817 | $1,761,700 | $975,000 | $786,700 |
| 2024 | $10,817 | $1,761,700 | $975,000 | $786,700 |
| 2023 | $10,729 | $1,761,700 | $975,000 | $786,700 |
| 2022 | $10,006 | $1,761,700 | $975,000 | $786,700 |
| 2021 | $9,637 | $1,761,700 | $975,000 | $786,700 |
| 2020 | $9,267 | $1,761,700 | $975,000 | $786,700 |
| 2019 | $8,985 | $1,761,700 | $975,000 | $786,700 |
| 2018 | $8,597 | $1,761,700 | $975,000 | $786,700 |
| 2017 | $7,612 | $1,369,100 | $650,000 | $719,100 |
| 2016 | $7,530 | $1,369,100 | $650,000 | $719,100 |
| 2015 | $7,407 | $1,369,100 | $650,000 | $719,100 |
| 2014 | $7,325 | $1,369,100 | $650,000 | $719,100 |
Source: Public Records
Map
Nearby Homes