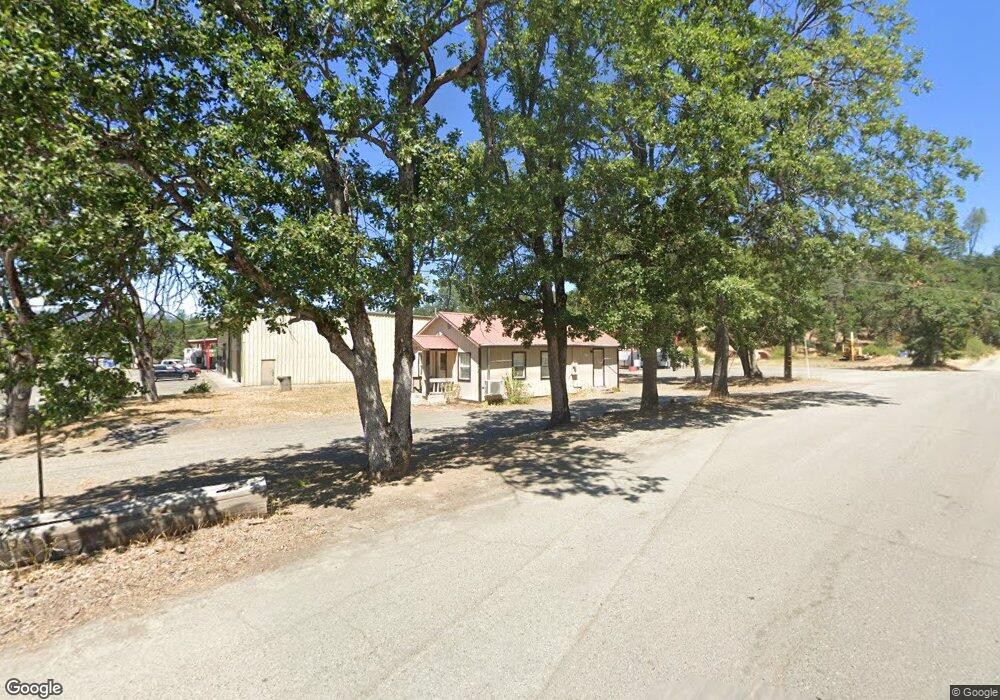
7691 State Highway 3 Hayfork, CA 96041
Estimated Value: $33,000
Studio
--
Bath
--
Sq Ft
21,780
Sq Ft
About This Home
This home is located at 7691 State Highway 3, Hayfork, CA 96041 and is currently priced at $33,000. 7691 State Highway 3 is a home with nearby schools including Hayfork High School.
Ownership History
Date
Name
Owned For
Owner Type
Purchase Details
Closed on
Sep 2, 2024
Sold by
J & S Bashore Trust
Bought by
Ropin Rhonda Trust
Current Estimated Value
Purchase Details
Closed on
Mar 5, 2016
Sold by
Bashore Summer
Bought by
The J & S Bashore Revocable Living Trust
Purchase Details
Closed on
Jul 9, 2012
Sold by
Murrison Kitt
Bought by
Bashore Summer
Home Financials for this Owner
Home Financials are based on the most recent Mortgage that was taken out on this home.
Original Mortgage
$25,000
Interest Rate
3.7%
Mortgage Type
Seller Take Back
Purchase Details
Closed on
Jul 5, 2012
Sold by
Bashore John C
Bought by
Bashore Summer
Home Financials for this Owner
Home Financials are based on the most recent Mortgage that was taken out on this home.
Original Mortgage
$25,000
Interest Rate
3.7%
Mortgage Type
Seller Take Back
Purchase Details
Closed on
Apr 28, 2005
Sold by
Murrison Kitt
Bought by
Murrison Kitt
Create a Home Valuation Report for This Property
The Home Valuation Report is an in-depth analysis detailing your home's value as well as a comparison with similar homes in the area
Home Values in the Area
Average Home Value in this Area
Purchase History
| Date | Buyer | Sale Price | Title Company |
|---|---|---|---|
| Ropin Rhonda Trust | $40,000 | None Listed On Document | |
| The J & S Bashore Revocable Living Trust | -- | None Available | |
| Bashore Summer | $35,000 | Placer Title Company | |
| Bashore Summer | -- | Placer Title Company | |
| Murrison Kitt | -- | -- |
Source: Public Records
Mortgage History
| Date | Status | Borrower | Loan Amount |
|---|---|---|---|
| Previous Owner | Bashore Summer | $25,000 |
Source: Public Records
Tax History
| Year | Tax Paid | Tax Assessment Tax Assessment Total Assessment is a certain percentage of the fair market value that is determined by local assessors to be the total taxable value of land and additions on the property. | Land | Improvement |
|---|---|---|---|---|
| 2025 | $653 | $65,000 | $40,000 | $25,000 |
| 2024 | $611 | $42,244 | $30,176 | $12,068 |
| 2023 | $611 | $41,417 | $29,585 | $11,832 |
| 2022 | $602 | $40,605 | $29,005 | $11,600 |
| 2021 | $567 | $39,810 | $28,437 | $11,373 |
| 2020 | $522 | $39,403 | $28,146 | $11,257 |
| 2019 | $514 | $38,632 | $27,595 | $11,037 |
| 2018 | $502 | $37,875 | $27,054 | $10,821 |
| 2017 | $491 | $37,133 | $26,524 | $10,609 |
| 2016 | $477 | $36,405 | $26,004 | $10,401 |
| 2015 | $481 | $35,859 | $25,614 | $10,245 |
| 2014 | $477 | $35,158 | $25,113 | $10,045 |
Source: Public Records
Map
Nearby Homes
Your Personal Tour Guide
Ask me questions while you tour the home.