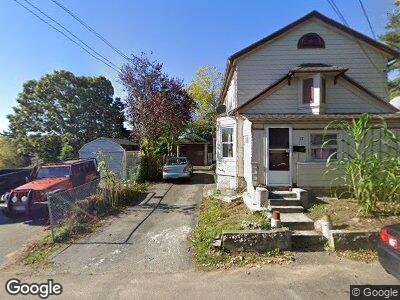
77 Ashcraft Rd New London, CT 06320
Jefferson NeighborhoodEstimated Value: $226,000 - $264,000
3
Beds
1
Bath
872
Sq Ft
$278/Sq Ft
Est. Value
About This Home
This home is located at 77 Ashcraft Rd, New London, CT 06320 and is currently estimated at $242,736, approximately $278 per square foot. 77 Ashcraft Rd is a home located in New London County with nearby schools including Harbor Elementary School, Bennie Dover Jackson Middle School, and New London High School.
Ownership History
Date
Name
Owned For
Owner Type
Purchase Details
Closed on
Dec 30, 1999
Sold by
Paskewich Maude R
Bought by
Medina Maria
Current Estimated Value
Home Financials for this Owner
Home Financials are based on the most recent Mortgage that was taken out on this home.
Original Mortgage
$73,900
Interest Rate
7.71%
Create a Home Valuation Report for This Property
The Home Valuation Report is an in-depth analysis detailing your home's value as well as a comparison with similar homes in the area
Home Values in the Area
Average Home Value in this Area
Purchase History
| Date | Buyer | Sale Price | Title Company |
|---|---|---|---|
| Medina Maria | $74,900 | -- |
Source: Public Records
Mortgage History
| Date | Status | Borrower | Loan Amount |
|---|---|---|---|
| Open | Medina Maria | $25,000 | |
| Closed | Paskewich Maude R | $50,000 | |
| Closed | Paskewich Maude R | $73,900 | |
| Previous Owner | Paskewich Maude R | $25,000 | |
| Closed | Paskewich Maude R | $6,000 |
Source: Public Records
Tax History Compared to Growth
Tax History
| Year | Tax Paid | Tax Assessment Tax Assessment Total Assessment is a certain percentage of the fair market value that is determined by local assessors to be the total taxable value of land and additions on the property. | Land | Improvement |
|---|---|---|---|---|
| 2024 | $3,383 | $123,000 | $40,000 | $83,000 |
| 2023 | $2,719 | $73,010 | $32,060 | $40,950 |
| 2022 | $2,724 | $73,010 | $32,060 | $40,950 |
| 2021 | $2,771 | $73,010 | $32,060 | $40,950 |
| 2020 | $2,788 | $73,010 | $32,060 | $40,950 |
| 2019 | $2,913 | $73,010 | $32,060 | $40,950 |
| 2018 | $3,138 | $71,750 | $30,800 | $40,950 |
| 2017 | $3,176 | $71,750 | $30,800 | $40,950 |
| 2016 | $2,903 | $71,750 | $30,800 | $40,950 |
| 2015 | $2,833 | $71,750 | $30,800 | $40,950 |
| 2014 | $2,459 | $71,750 | $30,800 | $40,950 |
Source: Public Records
Map
Nearby Homes