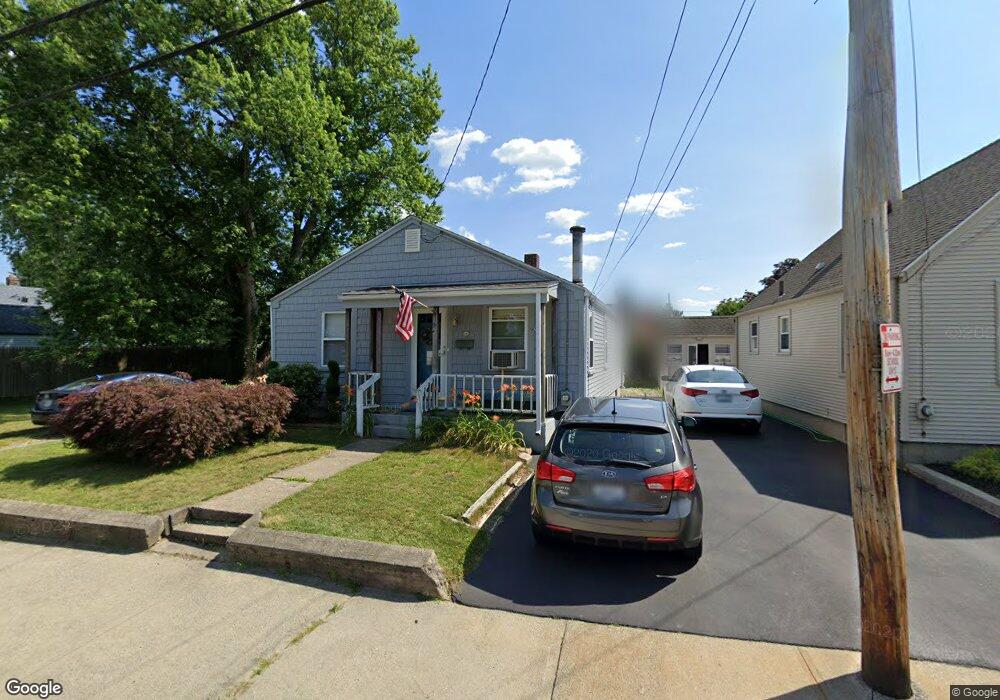
77 Crescent Ave Cranston, RI 02910
Stadium NeighborhoodEstimated Value: $324,000 - $347,000
2
Beds
1
Bath
800
Sq Ft
$419/Sq Ft
Est. Value
About This Home
This home is located at 77 Crescent Ave, Cranston, RI 02910 and is currently estimated at $335,592, approximately $419 per square foot. 77 Crescent Ave is a home located in Providence County with nearby schools including Stadium Elementary School, Hugh B. Bain Middle School, and Cranston High School East.
Ownership History
Date
Name
Owned For
Owner Type
Purchase Details
Closed on
Apr 23, 2021
Sold by
Dionne Stephen M and Dionne Kevin M
Bought by
Dionne Ft
Current Estimated Value
Purchase Details
Closed on
Apr 19, 2021
Sold by
Dionne Mary P
Bought by
Dionne Stephen M
Purchase Details
Closed on
Mar 1, 2019
Sold by
Dionne Mary P and Dionne Stephen M
Bought by
Dionne Mary P and Dionne Kevin M
Create a Home Valuation Report for This Property
The Home Valuation Report is an in-depth analysis detailing your home's value as well as a comparison with similar homes in the area
Home Values in the Area
Average Home Value in this Area
Purchase History
| Date | Buyer | Sale Price | Title Company |
|---|---|---|---|
| Dionne Ft | -- | None Available | |
| Dionne Stephen M | -- | None Available | |
| Dionne Mary P | -- | -- |
Source: Public Records
Mortgage History
| Date | Status | Borrower | Loan Amount |
|---|---|---|---|
| Previous Owner | Dionne Mary P | $16,000 |
Source: Public Records
Tax History Compared to Growth
Tax History
| Year | Tax Paid | Tax Assessment Tax Assessment Total Assessment is a certain percentage of the fair market value that is determined by local assessors to be the total taxable value of land and additions on the property. | Land | Improvement |
|---|---|---|---|---|
| 2025 | $3,571 | $257,300 | $92,100 | $165,200 |
| 2024 | $3,502 | $257,300 | $92,100 | $165,200 |
| 2023 | $3,493 | $184,800 | $63,500 | $121,300 |
| 2022 | $3,421 | $184,800 | $63,500 | $121,300 |
| 2021 | $3,326 | $184,800 | $63,500 | $121,300 |
| 2020 | $3,194 | $153,800 | $60,300 | $93,500 |
| 2019 | $3,194 | $153,800 | $60,300 | $93,500 |
| 2018 | $3,121 | $153,800 | $60,300 | $93,500 |
| 2017 | $2,833 | $123,500 | $44,500 | $79,000 |
| 2016 | $2,773 | $123,500 | $44,500 | $79,000 |
Source: Public Records
Map
Nearby Homes