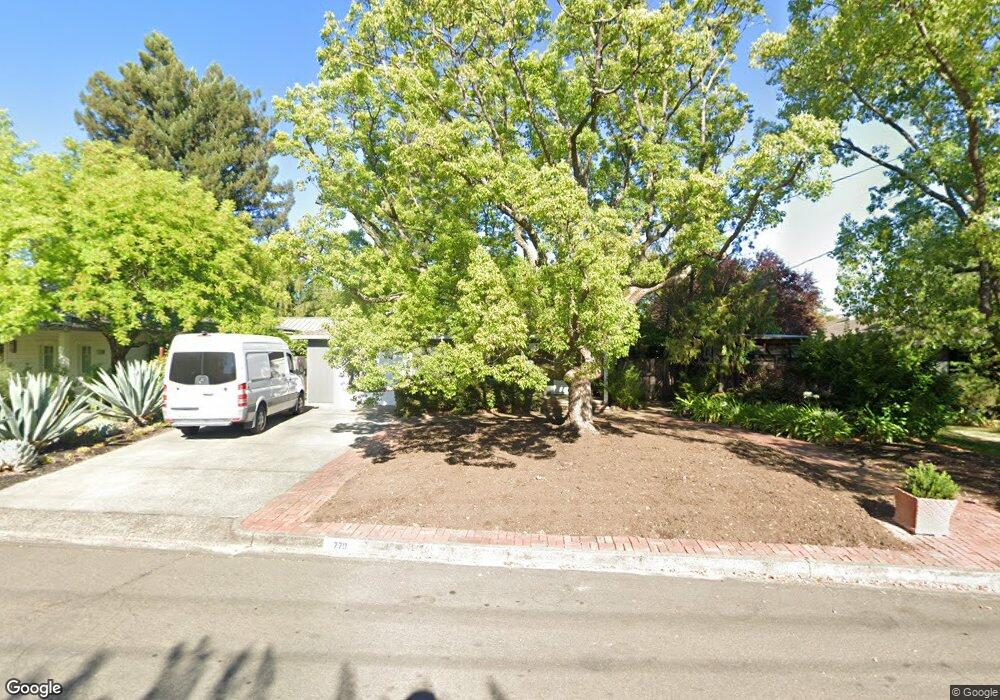
770 3rd St E Sonoma, CA 95476
Estimated Value: $1,317,811 - $1,581,000
3
Beds
2
Baths
1,588
Sq Ft
$894/Sq Ft
Est. Value
About This Home
This home is located at 770 3rd St E, Sonoma, CA 95476 and is currently estimated at $1,418,953, approximately $893 per square foot. 770 3rd St E is a home located in Sonoma County with nearby schools including Prestwood Elementary School, Adele Harrison Middle School, and Creekside High School.
Ownership History
Date
Name
Owned For
Owner Type
Purchase Details
Closed on
Dec 11, 2007
Sold by
Schurecht Schon
Bought by
Schurecht Schon and The Schon Schurecht Trust
Current Estimated Value
Purchase Details
Closed on
May 8, 2002
Sold by
Noe Mark W
Bought by
Schurecht Schon
Home Financials for this Owner
Home Financials are based on the most recent Mortgage that was taken out on this home.
Original Mortgage
$480,000
Outstanding Balance
$206,246
Interest Rate
7.18%
Estimated Equity
$1,212,707
Purchase Details
Closed on
Nov 7, 1996
Sold by
Noe Mark W
Bought by
Noe Mark W
Home Financials for this Owner
Home Financials are based on the most recent Mortgage that was taken out on this home.
Original Mortgage
$85,000
Interest Rate
8.06%
Purchase Details
Closed on
Mar 20, 1996
Sold by
Noe Mark W
Bought by
Noe Mark W
Create a Home Valuation Report for This Property
The Home Valuation Report is an in-depth analysis detailing your home's value as well as a comparison with similar homes in the area
Home Values in the Area
Average Home Value in this Area
Purchase History
| Date | Buyer | Sale Price | Title Company |
|---|---|---|---|
| Schurecht Schon | -- | None Available | |
| Schurecht Schon | $600,000 | First American Title Co | |
| Noe Mark W | -- | North Bay Title Co | |
| Noe Mark W | -- | -- |
Source: Public Records
Mortgage History
| Date | Status | Borrower | Loan Amount |
|---|---|---|---|
| Open | Schurecht Schon | $480,000 | |
| Previous Owner | Noe Mark W | $85,000 |
Source: Public Records
Tax History
| Year | Tax Paid | Tax Assessment Tax Assessment Total Assessment is a certain percentage of the fair market value that is determined by local assessors to be the total taxable value of land and additions on the property. | Land | Improvement |
|---|---|---|---|---|
| 2025 | $11,007 | $886,380 | $561,378 | $325,002 |
| 2024 | $11,007 | $869,001 | $550,371 | $318,630 |
| 2023 | $11,007 | $851,963 | $539,580 | $312,383 |
| 2022 | $10,600 | $835,258 | $529,000 | $306,258 |
| 2021 | $10,454 | $818,881 | $518,628 | $300,253 |
| 2020 | $10,344 | $810,486 | $513,311 | $297,175 |
| 2019 | $10,116 | $794,596 | $503,247 | $291,349 |
| 2018 | $9,972 | $779,017 | $493,380 | $285,637 |
| 2017 | $9,988 | $763,743 | $483,706 | $280,037 |
| 2016 | $9,258 | $748,769 | $474,222 | $274,547 |
| 2015 | $8,963 | $737,523 | $467,099 | $270,424 |
| 2014 | $9,102 | $723,077 | $457,950 | $265,127 |
Source: Public Records
Map
Nearby Homes
Your Personal Tour Guide
Ask me questions while you tour the home.