Estimated Value: $1,082,000 - $1,785,000
3
Beds
2
Baths
1,885
Sq Ft
$718/Sq Ft
Est. Value
About This Home
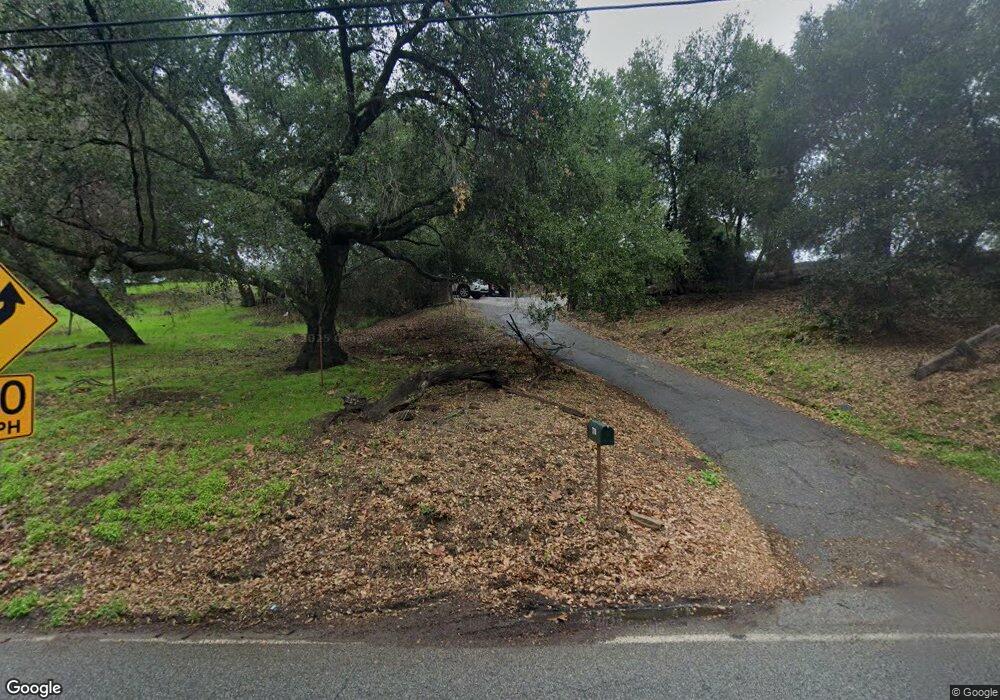
This home is located at 770 Creek Rd, Ojai, CA 93023 and is currently estimated at $1,353,386, approximately $717 per square foot. 770 Creek Rd is a home located in Ventura County with nearby schools including Topa Topa Elementary School, Meiners Oaks Elementary School, and Matilija Junior High.
Ownership History
Date
Name
Owned For
Owner Type
Purchase Details
Closed on
Mar 28, 2014
Sold by
Ball Ken and Hart Nancy Lynn
Bought by
Ball Ken
Current Estimated Value
Purchase Details
Closed on
Dec 24, 1998
Sold by
Ball Ken and Hart Nancy Lynn
Bought by
Ball Ken and Hart Nancy Lynn
Home Financials for this Owner
Home Financials are based on the most recent Mortgage that was taken out on this home.
Original Mortgage
$141,000
Interest Rate
6.4%
Purchase Details
Closed on
Mar 26, 1998
Sold by
Hart Nancy
Bought by
Hart Nancy Lynn
Purchase Details
Closed on
May 24, 1996
Sold by
Frampton Mary N
Bought by
Ball Ken and Hart Nancy
Home Financials for this Owner
Home Financials are based on the most recent Mortgage that was taken out on this home.
Original Mortgage
$145,000
Interest Rate
7.96%
Create a Home Valuation Report for This Property
The Home Valuation Report is an in-depth analysis detailing your home's value as well as a comparison with similar homes in the area
Home Values in the Area
Average Home Value in this Area
Purchase History
| Date | Buyer | Sale Price | Title Company |
|---|---|---|---|
| Ball Ken | -- | None Available | |
| Ball Ken | -- | Fidelity National Title | |
| Hart Nancy Lynn | -- | -- | |
| Ball Ken | $245,000 | Fidelity National Title Ins |
Source: Public Records
Mortgage History
| Date | Status | Borrower | Loan Amount |
|---|---|---|---|
| Closed | Ball Ken | $141,000 | |
| Closed | Ball Ken | $145,000 | |
| Closed | Ball Ken | $40,000 |
Source: Public Records
Tax History
| Year | Tax Paid | Tax Assessment Tax Assessment Total Assessment is a certain percentage of the fair market value that is determined by local assessors to be the total taxable value of land and additions on the property. | Land | Improvement |
|---|---|---|---|---|
| 2025 | $5,455 | $434,661 | $249,174 | $185,487 |
| 2024 | $5,455 | $426,139 | $244,289 | $181,850 |
| 2023 | $5,278 | $417,784 | $239,499 | $178,285 |
| 2022 | $5,175 | $409,593 | $234,803 | $174,790 |
| 2021 | $5,141 | $401,562 | $230,199 | $171,363 |
| 2020 | $5,016 | $397,446 | $227,840 | $169,606 |
| 2019 | $4,870 | $389,654 | $223,373 | $166,281 |
| 2018 | $4,823 | $382,015 | $218,994 | $163,021 |
| 2017 | $4,721 | $374,525 | $214,700 | $159,825 |
| 2016 | $4,058 | $367,183 | $210,491 | $156,692 |
| 2015 | $4,030 | $361,670 | $207,330 | $154,340 |
| 2014 | $3,710 | $354,588 | $203,270 | $151,318 |
Source: Public Records
Map
Nearby Homes
- 10522 62 Creek Rd
- 561 Saddle Ln
- 300 W Santa Ana St
- 741 Saddle Ln
- 207 S Blanche St
- 312 Fox St
- 211 Fox St
- 203 Foothill Rd
- 202 N Carrillo Rd Unit E
- 212 Foothill Rd
- 310 E Matilija St
- 211 N Signal St
- 608 E Ojai Ave
- 203 N Carrillo Rd Unit B
- 203 N Carrillo Rd Unit B
- 0 N Ventura Unit TR25015633
- 408 Canada St
- 201 Drown Ave
- 1318 La Paz Dr
- 1090 Cuyama Rd
- 101 Longhorn Ln
- 101 Longhorn Ln Unit A
- 101 Longhorn Ln
- 101 Longhorn Ln Unit A
- 101 Longhorn Ln
- 100 Longhorn Ln
- 121 Longhorn Ln
- 140 Longhorn Ln
- 131 Longhorn Ln
- 904 Creek Rd
- 160 Longhorn Ln
- 141 Longhorn Ln
- 180 Longhorn Ln
- 1020 Amber Dr
- 1020 Amber Dr
- 251 Saddle Ln
- 200 Longhorn Ln
- 230 Saddle Ln
- 1052 Amber Dr
- 1187 Creek Rd
Your Personal Tour Guide
Ask me questions while you tour the home.