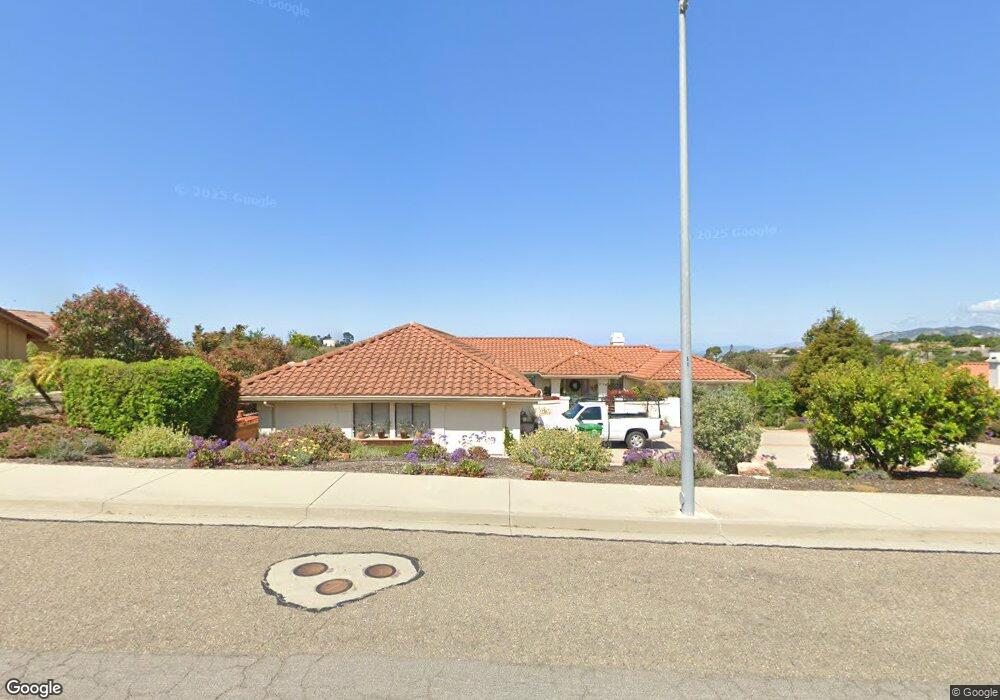
770 Via Bandolero Unit 1 Arroyo Grande, CA 93420
Estimated Value: $1,451,480 - $1,565,000
3
Beds
2
Baths
2,857
Sq Ft
$530/Sq Ft
Est. Value
About This Home
This home is located at 770 Via Bandolero Unit 1, Arroyo Grande, CA 93420 and is currently estimated at $1,515,370, approximately $530 per square foot. 770 Via Bandolero Unit 1 is a home located in San Luis Obispo County with nearby schools including Ocean View Elementary School, Judkins Middle School, and Arroyo Grande High School.
Ownership History
Date
Name
Owned For
Owner Type
Purchase Details
Closed on
Jul 2, 2021
Sold by
Sage Kenneth G and Sage Mary J
Bought by
Stein Michael F and The Michael F Stein Family Tru
Current Estimated Value
Purchase Details
Closed on
Jan 13, 2000
Sold by
Simpson James D and Simpson Elizabeth C
Bought by
Sage Kenneth G and Sage Mary J
Home Financials for this Owner
Home Financials are based on the most recent Mortgage that was taken out on this home.
Original Mortgage
$304,000
Interest Rate
3.95%
Purchase Details
Closed on
Feb 25, 1999
Sold by
Smullen Robert A and Smullen Donna Kay
Bought by
Simpson James D and Simpson Elizabeth C
Home Financials for this Owner
Home Financials are based on the most recent Mortgage that was taken out on this home.
Original Mortgage
$292,000
Interest Rate
6.73%
Create a Home Valuation Report for This Property
The Home Valuation Report is an in-depth analysis detailing your home's value as well as a comparison with similar homes in the area
Home Values in the Area
Average Home Value in this Area
Purchase History
| Date | Buyer | Sale Price | Title Company |
|---|---|---|---|
| Stein Michael F | $1,115,000 | First American Title Company | |
| Sage Kenneth G | $385,000 | Fidelity National Title Co | |
| Simpson James D | $365,000 | First American Title Ins Co |
Source: Public Records
Mortgage History
| Date | Status | Borrower | Loan Amount |
|---|---|---|---|
| Previous Owner | Sage Kenneth G | $304,000 | |
| Previous Owner | Simpson James D | $292,000 |
Source: Public Records
Tax History Compared to Growth
Tax History
| Year | Tax Paid | Tax Assessment Tax Assessment Total Assessment is a certain percentage of the fair market value that is determined by local assessors to be the total taxable value of land and additions on the property. | Land | Improvement |
|---|---|---|---|---|
| 2025 | $12,240 | $1,183,246 | $557,134 | $626,112 |
| 2024 | $12,100 | $1,160,046 | $546,210 | $613,836 |
| 2023 | $12,100 | $1,137,300 | $535,500 | $601,800 |
| 2022 | $11,917 | $1,115,000 | $525,000 | $590,000 |
| 2021 | $6,237 | $580,214 | $212,979 | $367,235 |
| 2020 | $6,165 | $574,266 | $210,796 | $363,470 |
| 2019 | $6,119 | $563,007 | $206,663 | $356,344 |
| 2018 | $6,044 | $551,968 | $202,611 | $349,357 |
| 2017 | $5,942 | $541,146 | $198,639 | $342,507 |
| 2016 | $5,612 | $530,537 | $194,745 | $335,792 |
| 2015 | $5,565 | $522,569 | $191,820 | $330,749 |
| 2014 | $5,361 | $512,334 | $188,063 | $324,271 |
Source: Public Records
Map
Nearby Homes
- 758 Via Bandolero
- 413 Via Bandolero
- 579 Camino Mercado Unit 305
- 277 Hillcrest Dr Unit 13
- 282 Robles Rd Unit 19
- 334 Corona Del Terra
- 553 Rosemary Ln
- 289 Mercedes Ln
- 1057 Meadow Way
- 411 Cornwall Ave
- 434 Spanish Moss Ln
- 411 Spanish Moss Ln
- 182 Fair View Dr
- 280 Chelsea Ct
- 1024 Robin Cir
- 0 N Oak Park Blvd
- 1950 Newport Ave
- 212 Miller Way
- 1773 Newport Ave
- 117 Village Cir
- 770 Via Bandolero
- 784 Via Bandolero
- 759 Via Bandolero
- 781 Avenida de Diamante
- 808 Via Bandolero
- 746 Via Bandolero
- 750 Avenida de Diamante
- 769 Avenida de Diamante
- 785 Via Bandolero
- 734 Via Bandolero
- 745 Avenida de Diamante
- 799 Via Bandolero
- 731 Via Bandolero
- 708 Avenida de Diamante
- 764 Via Vaquero
- 720 Via Bandolero
- 703 Avenida de Diamante
- 728 Via Vaquero
- 670 Avenida de Diamante