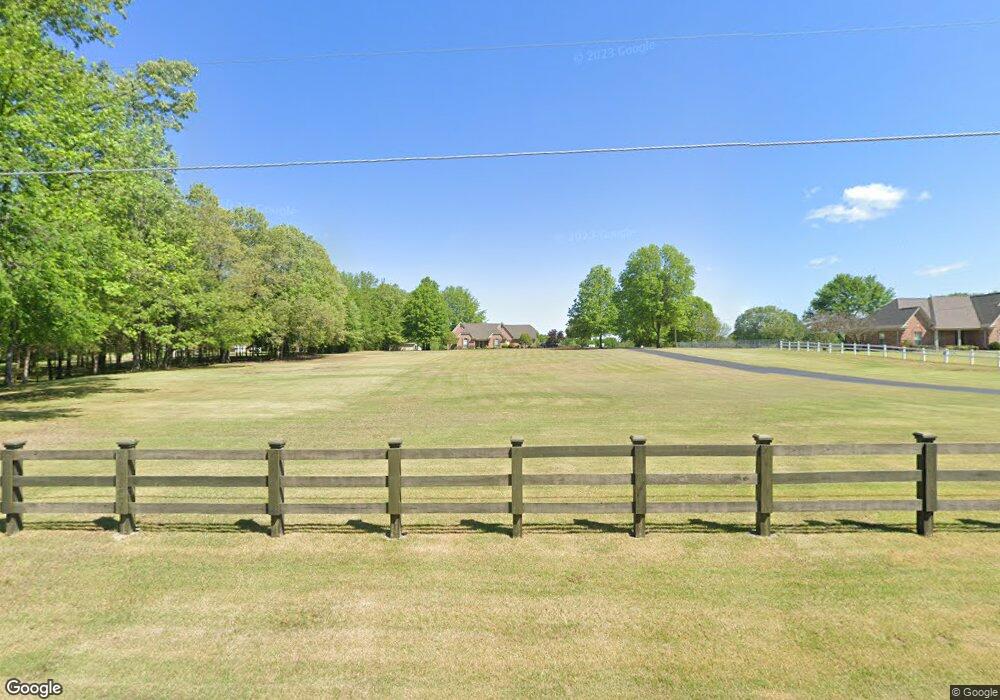
7700 Braden Rd Arlington, TN 38002
Estimated Value: $436,387 - $512,000
--
Bed
3
Baths
2,033
Sq Ft
$229/Sq Ft
Est. Value
About This Home
This home is located at 7700 Braden Rd, Arlington, TN 38002 and is currently estimated at $466,097, approximately $229 per square foot. 7700 Braden Rd is a home located in Fayette County with nearby schools including Oakland Elementary School, West Junior High School, and Fayette Ware Comprehensive High School.
Ownership History
Date
Name
Owned For
Owner Type
Purchase Details
Closed on
Dec 23, 2024
Sold by
Grissom Michael Eugene
Bought by
Olberding Anna E
Current Estimated Value
Home Financials for this Owner
Home Financials are based on the most recent Mortgage that was taken out on this home.
Original Mortgage
$348,000
Outstanding Balance
$345,289
Interest Rate
6.84%
Mortgage Type
New Conventional
Estimated Equity
$120,808
Purchase Details
Closed on
Aug 23, 2022
Sold by
Grissom Deborah Lynn Odell
Bought by
Grissom Michael Eugene
Purchase Details
Closed on
Jul 29, 1998
Sold by
Higdon James Larry
Bought by
Grissom Michael E and Grissom Debora
Purchase Details
Closed on
Jun 5, 1997
Bought by
Higson James
Purchase Details
Closed on
Jun 2, 1997
Bought by
Higdon James Larry and Higdon Nancy Jane
Purchase Details
Closed on
Feb 9, 1995
Sold by
Canepari J F
Bought by
Canepari J R Corp
Purchase Details
Closed on
Nov 30, 1993
Bought by
Canepari J F
Create a Home Valuation Report for This Property
The Home Valuation Report is an in-depth analysis detailing your home's value as well as a comparison with similar homes in the area
Home Values in the Area
Average Home Value in this Area
Purchase History
| Date | Buyer | Sale Price | Title Company |
|---|---|---|---|
| Olberding Anna E | $435,000 | Hornsby Title | |
| Olberding Anna E | $435,000 | Hornsby Title | |
| Grissom Michael Eugene | -- | None Listed On Document | |
| Grissom Michael E | $192,000 | -- | |
| Higson James | $16,400 | -- | |
| Higdon James Larry | $164,000 | -- | |
| Canepari J R Corp | $35,000 | -- | |
| Canepari J F | -- | -- |
Source: Public Records
Mortgage History
| Date | Status | Borrower | Loan Amount |
|---|---|---|---|
| Open | Olberding Anna E | $348,000 | |
| Closed | Olberding Anna E | $348,000 |
Source: Public Records
Tax History Compared to Growth
Tax History
| Year | Tax Paid | Tax Assessment Tax Assessment Total Assessment is a certain percentage of the fair market value that is determined by local assessors to be the total taxable value of land and additions on the property. | Land | Improvement |
|---|---|---|---|---|
| 2024 | $830 | $64,300 | $19,925 | $44,375 |
| 2023 | $830 | $64,300 | $0 | $0 |
| 2022 | $830 | $64,300 | $19,925 | $44,375 |
| 2021 | $830 | $64,300 | $19,925 | $44,375 |
| 2020 | $885 | $64,300 | $19,925 | $44,375 |
| 2019 | $885 | $58,725 | $19,925 | $38,800 |
| 2018 | $885 | $58,725 | $19,925 | $38,800 |
| 2017 | $885 | $58,725 | $19,925 | $38,800 |
| 2016 | $889 | $55,400 | $24,150 | $31,250 |
| 2015 | $889 | $55,400 | $24,150 | $31,250 |
| 2014 | $889 | $55,400 | $24,150 | $31,250 |
Source: Public Records
Map
Nearby Homes
- 25 Riversedge Cove N
- 20 Camden Cove
- 235 Amherst Dr
- 1225 Fields Dr
- 21565 Hwy 196 Hwy
- 25 Lancaster Dr
- 255 Cedar Grove Dr
- 220 Willow Bend Way
- 135 Thistle Dr
- 18670 Tennessee 196
- 00 Donelson Dr
- 50 Breezy Meadows Cove
- 2605 Harrell Dr
- 18160 Tennessee 196
- 75 Breezy Meadows Cove
- 10161 Conner Field Ln
- 10147 Conner Field Ln
- 245 Cypress Lake Cove
- 30 Bell Grove Rd
- 20 Bell Grove Rd
- 7680 Braden Rd
- 7780 Braden Rd
- 7550 Braden Rd
- 7660 Braden Rd
- 7820 Braden Rd
- 7695 Braden Rd
- 7340 Braden Rd
- 7670 Braden Rd
- 20470 Highway 196
- 195 Julie Cove
- 140 Hidden Grove Ct
- 175 Julie Cove
- 7555 Braden Rd
- 20740 Highway 196
- 7585 Braden Rd
- 7425 Braden Rd
- 105 Hidden Grove Ct
- 180 Hidden Grove Ct
- 145 Hidden Grove Ct
- 7675 Braden Rd