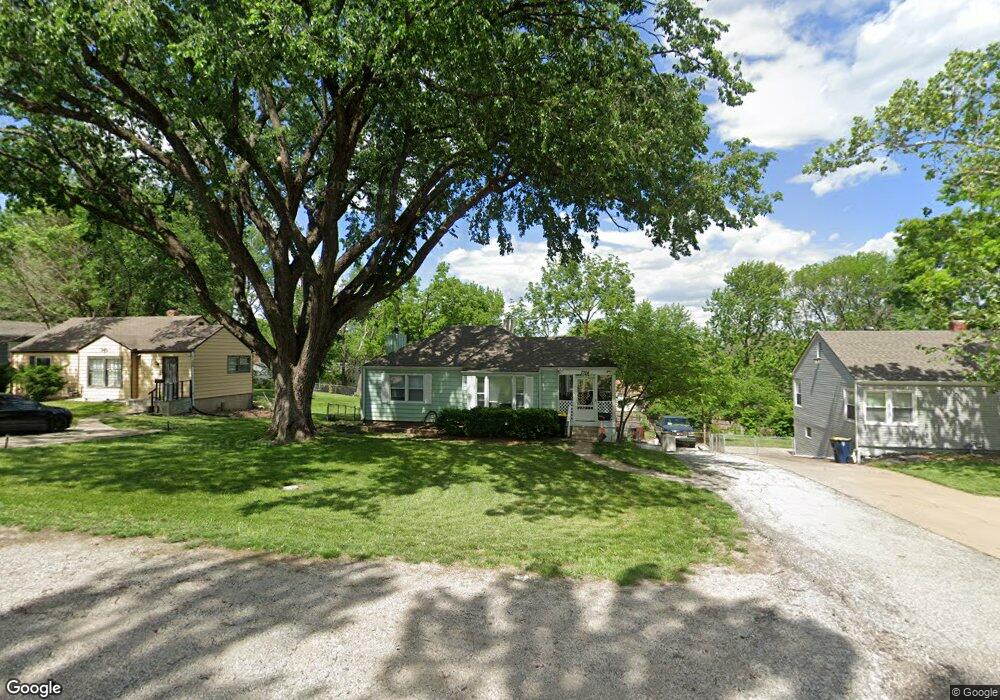
7704 Sni A Bar Rd Kansas City, MO 64129
Eastwood Hills East NeighborhoodEstimated Value: $121,000 - $165,000
2
Beds
1
Bath
805
Sq Ft
$170/Sq Ft
Est. Value
About This Home
This home is located at 7704 Sni A Bar Rd, Kansas City, MO 64129 and is currently estimated at $137,165, approximately $170 per square foot. 7704 Sni A Bar Rd is a home located in Jackson County with nearby schools including Eastwood Hills Elementary, Raytown Middle School, and Raytown South High School.
Ownership History
Date
Name
Owned For
Owner Type
Purchase Details
Closed on
Aug 17, 2007
Sold by
Tropical Bay Llc
Bought by
Nitchals Amy M
Current Estimated Value
Purchase Details
Closed on
Sep 20, 2006
Sold by
Hud
Bought by
Tropical Bay Llc
Purchase Details
Closed on
Mar 28, 2006
Sold by
Bank Of America Na
Bought by
Hud
Purchase Details
Closed on
Jan 25, 2006
Sold by
Southern Danyl Jo
Bought by
Bank Of America Na
Purchase Details
Closed on
Jul 18, 2002
Sold by
Larimer Andrea J Southern and Southern Andrea J
Bought by
Southern Danyl Jo
Home Financials for this Owner
Home Financials are based on the most recent Mortgage that was taken out on this home.
Original Mortgage
$56,078
Interest Rate
6.73%
Mortgage Type
FHA
Purchase Details
Closed on
Jul 17, 2002
Sold by
Larimer Philip and Larimer Philip Dexter
Bought by
Souther Danyl Jo
Home Financials for this Owner
Home Financials are based on the most recent Mortgage that was taken out on this home.
Original Mortgage
$56,078
Interest Rate
6.73%
Mortgage Type
FHA
Create a Home Valuation Report for This Property
The Home Valuation Report is an in-depth analysis detailing your home's value as well as a comparison with similar homes in the area
Home Values in the Area
Average Home Value in this Area
Purchase History
| Date | Buyer | Sale Price | Title Company |
|---|---|---|---|
| Nitchals Amy M | -- | Commonwealth Land Title Insu | |
| Tropical Bay Llc | -- | First American Title Co | |
| Hud | -- | None Available | |
| Bank Of America Na | $58,401 | None Available | |
| Southern Danyl Jo | -- | Old Republic Title Company | |
| Souther Danyl Jo | -- | -- |
Source: Public Records
Mortgage History
| Date | Status | Borrower | Loan Amount |
|---|---|---|---|
| Previous Owner | Souther Danyl Jo | $56,078 |
Source: Public Records
Tax History Compared to Growth
Tax History
| Year | Tax Paid | Tax Assessment Tax Assessment Total Assessment is a certain percentage of the fair market value that is determined by local assessors to be the total taxable value of land and additions on the property. | Land | Improvement |
|---|---|---|---|---|
| 2025 | $959 | $11,057 | $2,383 | $8,674 |
| 2024 | $953 | $10,593 | $1,497 | $9,096 |
| 2023 | $953 | $10,593 | $1,131 | $9,462 |
| 2022 | $782 | $8,360 | $1,862 | $6,498 |
| 2021 | $782 | $8,360 | $1,862 | $6,498 |
| 2020 | $794 | $8,389 | $1,862 | $6,527 |
| 2019 | $779 | $8,389 | $1,862 | $6,527 |
| 2018 | $695 | $7,515 | $2,082 | $5,433 |
| 2017 | $683 | $7,515 | $2,082 | $5,433 |
| 2016 | $683 | $7,437 | $2,153 | $5,284 |
| 2014 | $666 | $7,220 | $2,090 | $5,130 |
Source: Public Records
Map
Nearby Homes
- 7803 E 50th Terrace
- 5002 Skiles Ave
- 4701 Skiles Ave
- 7605 Sni A Bar Terrace
- 5132 Skiles Ave
- 4958 Marsh Ave
- 7509 E 50th St
- 7504 E 49th St
- 7700 E 48th Terrace
- 7525 E 52nd St
- 7405 E 49th St
- 7615 E 48th St
- 4949 Laramie Ln
- 4881 Wallace Ave
- 5117 Booth Ave
- 5119 Booth Ave
- 5140 Booth Ave
- 7152 Sni A Bar Rd
- 8705 E 53rd Terrace
- 6876 Sni A Bar Rd
- 7702 Sni A Bar Rd
- 7706 Sni A Bar Rd
- 7622 Sni A Bar Rd
- 7708 Sni A Bar Rd
- 7707 Sni A Bar Rd
- 7709 Sni A Bar Rd
- 7703 Sni A Bar Terrace
- 7705 Sni A Bar Rd
- 7705 Sni A Bar Terrace
- 7711 Sni A Bar Rd
- 7710 Sni A Bar Rd
- 7701 Sni A Bar Terrace
- 7620 Sni A Bar Rd
- 7703 Sni A Bar Rd
- 7707 Sni A Bar Terrace
- 7619 Sni A Bar Terrace
- 7713 Sni A Bar Rd
- 7709 Sni A Bar Terrace
- 7701 Sni A Bar Rd
- 7715 Sni A Bar Rd