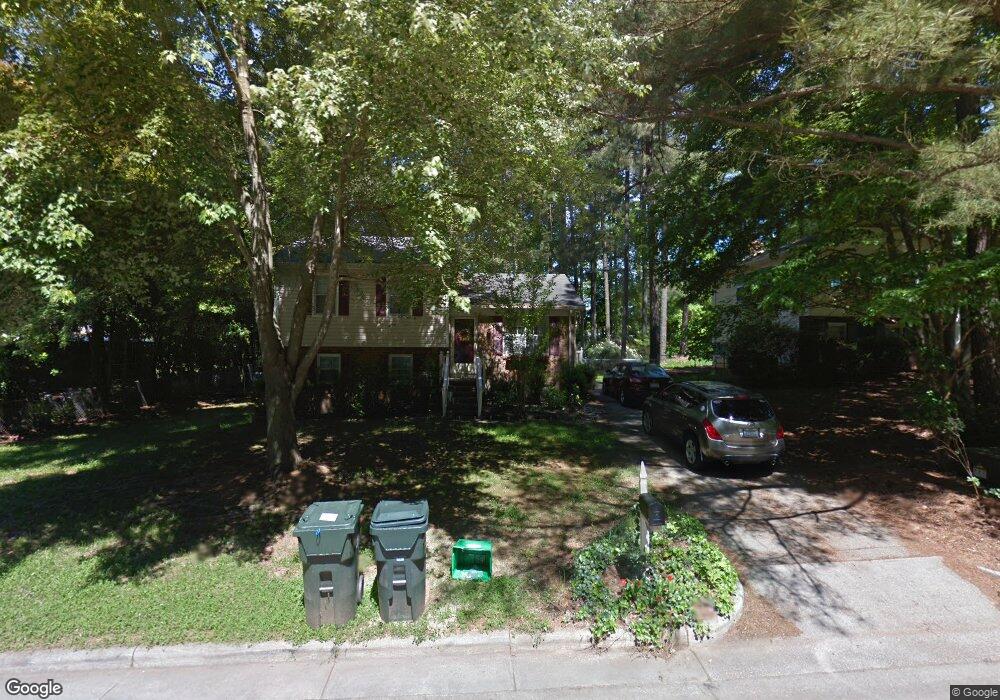
7705 Cart Track Trail Raleigh, NC 27615
Estimated Value: $349,138 - $413,000
3
Beds
2
Baths
1,543
Sq Ft
$239/Sq Ft
Est. Value
About This Home
This home is located at 7705 Cart Track Trail, Raleigh, NC 27615 and is currently estimated at $368,785, approximately $239 per square foot. 7705 Cart Track Trail is a home located in Wake County with nearby schools including Lead Mine Elementary School, West Millbrook Middle School, and Sanderson High School.
Ownership History
Date
Name
Owned For
Owner Type
Purchase Details
Closed on
Jul 10, 2017
Sold by
National Residential Nominee Services In
Bought by
Cook Savannah
Current Estimated Value
Home Financials for this Owner
Home Financials are based on the most recent Mortgage that was taken out on this home.
Original Mortgage
$179,450
Outstanding Balance
$149,297
Interest Rate
3.94%
Mortgage Type
New Conventional
Estimated Equity
$219,488
Purchase Details
Closed on
Oct 9, 2015
Sold by
Lascala Erin N and Cook Erin N
Bought by
Lascala Phil and Lascala Erin N
Purchase Details
Closed on
Aug 26, 2010
Sold by
Robbins Jennifer F and Robbins Andrew Dale
Bought by
Cook Erin N
Home Financials for this Owner
Home Financials are based on the most recent Mortgage that was taken out on this home.
Original Mortgage
$154,913
Interest Rate
4.61%
Mortgage Type
FHA
Create a Home Valuation Report for This Property
The Home Valuation Report is an in-depth analysis detailing your home's value as well as a comparison with similar homes in the area
Home Values in the Area
Average Home Value in this Area
Purchase History
| Date | Buyer | Sale Price | Title Company |
|---|---|---|---|
| Cook Savannah | $185,000 | None Available | |
| Lascala Phil | -- | Attorney | |
| Cook Erin N | $157,000 | None Available |
Source: Public Records
Mortgage History
| Date | Status | Borrower | Loan Amount |
|---|---|---|---|
| Open | Cook Savannah | $179,450 | |
| Previous Owner | Cook Erin N | $154,913 |
Source: Public Records
Tax History Compared to Growth
Tax History
| Year | Tax Paid | Tax Assessment Tax Assessment Total Assessment is a certain percentage of the fair market value that is determined by local assessors to be the total taxable value of land and additions on the property. | Land | Improvement |
|---|---|---|---|---|
| 2025 | $2,624 | $298,639 | $175,000 | $123,639 |
| 2024 | $2,614 | $298,639 | $175,000 | $123,639 |
| 2023 | $2,270 | $206,456 | $107,000 | $99,456 |
| 2022 | $2,110 | $206,456 | $107,000 | $99,456 |
| 2021 | $2,029 | $206,456 | $107,000 | $99,456 |
| 2020 | $1,992 | $206,456 | $107,000 | $99,456 |
| 2019 | $1,588 | $135,262 | $56,000 | $79,262 |
| 2018 | $1,498 | $135,262 | $56,000 | $79,262 |
| 2017 | $1,427 | $135,262 | $56,000 | $79,262 |
| 2016 | $1,398 | $135,262 | $56,000 | $79,262 |
| 2015 | $1,415 | $134,700 | $56,000 | $78,700 |
| 2014 | $1,342 | $134,700 | $56,000 | $78,700 |
Source: Public Records
Map
Nearby Homes
- 721 Tan Tara Square
- 8015 Brown Bark Place
- 7340 Doverton Ct
- 7804 Brandyapple Dr
- 8004 Thrush Ridge Ln
- 8021 Thrush Ridge Ln
- 1032 Vestavia Woods Dr
- 7216 Bluffside Ct
- 7820 Harbor Dr
- 8124 Upper Lake Dr
- 8011 Allyns Landing Way Unit 302
- 8011 Allyns Landing Way Unit 202
- 1024 Mockingbird Dr
- 8121 Greys Landing Way
- 1104 Theresa Ct
- 42 Renwick Ct
- 206 Nouveau Ave
- 7412 Post Oak Rd
- 302 Bon Marche Ln
- 8231 Allyns Landing Way Unit 101
- 7709 Cart Track Trail
- 808 Sawmill Rd
- 7713 Cart Track Trail
- 804 Sawmill Rd
- 7704 Cart Track Trail
- 7717 Cart Track Trail
- 7708 Cart Track Trail
- 7712 Cart Track Trail
- 800 Sawmill Rd
- 801 Sawmill Rd
- 7712 Cart Track Trail
- 7721 Cart Track Trail
- 724 Sawmill Rd
- 7716 Cart Track Trail
- 7649 Mine Valley Rd
- 7700 Nugget Ln
- 7701 Nugget Ln
- 7720 Cart Track Trail
- 7725 Cart Track Trail
- 7645 Mine Valley Rd