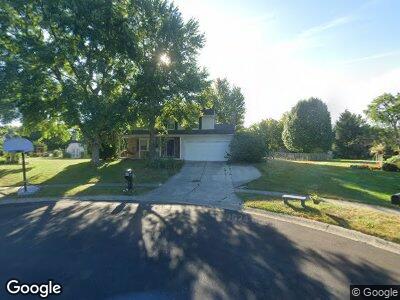
7705 Creekside Ct Fishers, IN 46038
Estimated Value: $360,000 - $399,040
4
Beds
3
Baths
1,876
Sq Ft
$201/Sq Ft
Est. Value
About This Home
This home is located at 7705 Creekside Ct, Fishers, IN 46038 and is currently estimated at $376,510, approximately $200 per square foot. 7705 Creekside Ct is a home located in Hamilton County with nearby schools including New Britton Elementary School, Riverside Junior High School, and Riverside Intermediate School.
Ownership History
Date
Name
Owned For
Owner Type
Purchase Details
Closed on
Feb 3, 2009
Sold by
Beneficial Indiana Inc
Bought by
Greenwood Robert B
Current Estimated Value
Home Financials for this Owner
Home Financials are based on the most recent Mortgage that was taken out on this home.
Original Mortgage
$119,920
Outstanding Balance
$77,829
Interest Rate
5.2%
Mortgage Type
Purchase Money Mortgage
Estimated Equity
$298,681
Purchase Details
Closed on
Nov 17, 2008
Sold by
Gines Andrew and Gines Hope M
Bought by
Beneficial Indiana Inc
Purchase Details
Closed on
Mar 19, 2004
Sold by
Liebeno Tim and Liebeno Jodi S
Bought by
Gines Andrew and Gines Hope M
Home Financials for this Owner
Home Financials are based on the most recent Mortgage that was taken out on this home.
Original Mortgage
$134,200
Interest Rate
6.5%
Mortgage Type
Purchase Money Mortgage
Create a Home Valuation Report for This Property
The Home Valuation Report is an in-depth analysis detailing your home's value as well as a comparison with similar homes in the area
Home Values in the Area
Average Home Value in this Area
Purchase History
| Date | Buyer | Sale Price | Title Company |
|---|---|---|---|
| Greenwood Robert B | -- | Reo Title Services | |
| Beneficial Indiana Inc | $158,240 | None Available | |
| Gines Andrew | -- | -- |
Source: Public Records
Mortgage History
| Date | Status | Borrower | Loan Amount |
|---|---|---|---|
| Open | Greenwood Robert B | $119,920 | |
| Previous Owner | Gines Andrew | $180,594 | |
| Previous Owner | Gines Andrew | $134,200 | |
| Closed | Gines Andrew | $33,500 |
Source: Public Records
Tax History Compared to Growth
Tax History
| Year | Tax Paid | Tax Assessment Tax Assessment Total Assessment is a certain percentage of the fair market value that is determined by local assessors to be the total taxable value of land and additions on the property. | Land | Improvement |
|---|---|---|---|---|
| 2024 | $3,274 | $341,000 | $86,000 | $255,000 |
| 2023 | $3,274 | $336,900 | $72,700 | $264,200 |
| 2022 | $2,961 | $287,200 | $72,700 | $214,500 |
| 2021 | $2,585 | $256,700 | $72,700 | $184,000 |
| 2020 | $2,327 | $237,800 | $72,700 | $165,100 |
| 2019 | $2,070 | $224,600 | $36,800 | $187,800 |
| 2018 | $1,820 | $208,200 | $36,800 | $171,400 |
| 2017 | $1,574 | $192,900 | $36,800 | $156,100 |
| 2016 | $1,515 | $189,500 | $36,800 | $152,700 |
| 2014 | $1,265 | $178,100 | $36,800 | $141,300 |
| 2013 | $1,265 | $173,100 | $36,900 | $136,200 |
Source: Public Records
Map
Nearby Homes
- 12005 Hardwick Dr
- 7656 Madden Ln
- 107 Northwood Dr
- 7645 Madden Dr
- 8194 Bostic Ct
- 8180 E 116th St
- 12577 Pointer Place
- 315 Heritage Ct
- 12755 Allisonville Rd
- 11940 Citywalk Dr
- 582 Conner Creek Dr
- 11469 Woodview Ct
- 601 Conner Creek Dr
- 12458 Trumbull Ct
- 8677 Morgan Dr
- 8704 Morgan Dr
- 7110 Koldyke Dr
- 8740 Morgan Dr
- 615 Conner Creek Dr
- 11199 Boston Way
- 7705 Creekside Ct
- 7703 Creekside Ct
- 12026 Colbarn Dr
- 12028 Colbarn Dr
- 7706 Creekside Ct
- 12024 Colbarn Dr
- 7701 Creekside Ct
- 12020 Colbarn Dr
- 12022 Colbarn Dr
- 7704 Creekside Ct
- 12030 Colbarn Dr
- 12018 Colbarn Dr
- 7702 Creekside Ct
- 7699 Creekside Ct
- 5873 Dawson Dr
- 7705 Creekside Dr
- 12016 Colbarn Dr
- 7703 Creekside Dr
- 7707 Creekside Dr
- 12025 Colbarn Dr