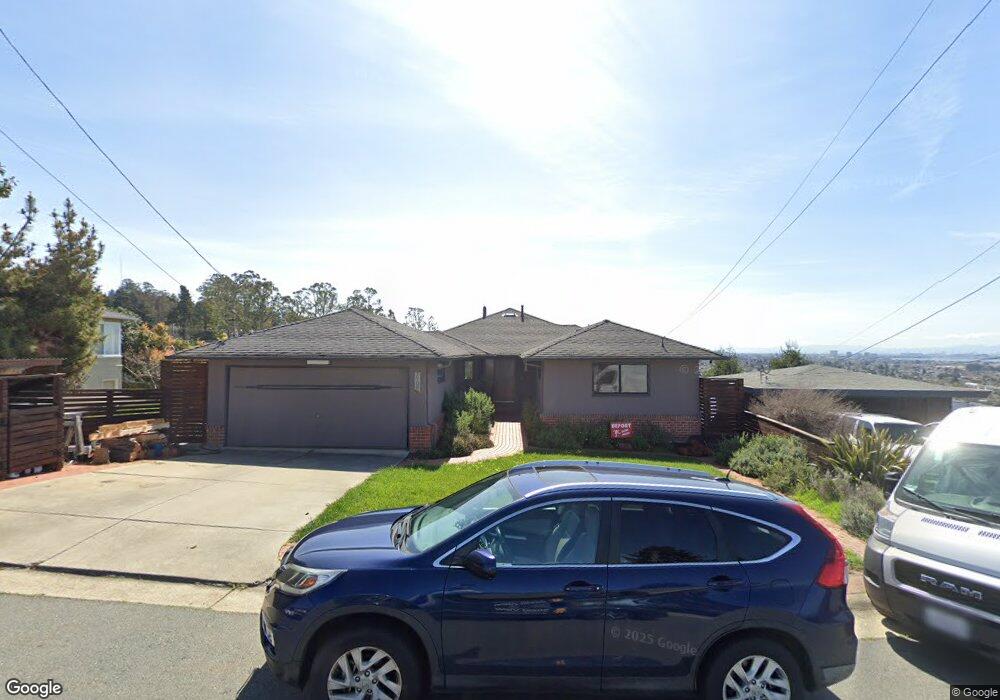
7708 Ricardo Ct El Cerrito, CA 94530
Estimated Value: $1,600,000 - $2,010,000
5
Beds
3
Baths
3,226
Sq Ft
$561/Sq Ft
Est. Value
About This Home
This home is located at 7708 Ricardo Ct, El Cerrito, CA 94530 and is currently estimated at $1,810,378, approximately $561 per square foot. 7708 Ricardo Ct is a home located in Contra Costa County with nearby schools including Harding Elementary School, Fred T. Korematsu Middle School, and El Cerrito Senior High School.
Ownership History
Date
Name
Owned For
Owner Type
Purchase Details
Closed on
Aug 4, 2016
Sold by
Nystrom Ricky Eugene and Nystrom Hannah
Bought by
Nystrom Ricky E and Nystrom Hannah W
Current Estimated Value
Home Financials for this Owner
Home Financials are based on the most recent Mortgage that was taken out on this home.
Original Mortgage
$725,000
Outstanding Balance
$578,466
Interest Rate
3.48%
Mortgage Type
New Conventional
Estimated Equity
$1,231,912
Purchase Details
Closed on
Jan 20, 2015
Sold by
Nystrom Ricky E and Nystrom Hannah W
Bought by
The Ricky Eugene Nystrom & Hannah Wedgel
Purchase Details
Closed on
Nov 20, 2012
Sold by
Garbarino Joseph W and Garbarino Mary Jane
Bought by
Nystrom Ricky E and Nystrom Hannah Wedgley
Home Financials for this Owner
Home Financials are based on the most recent Mortgage that was taken out on this home.
Original Mortgage
$567,000
Interest Rate
3.36%
Mortgage Type
New Conventional
Create a Home Valuation Report for This Property
The Home Valuation Report is an in-depth analysis detailing your home's value as well as a comparison with similar homes in the area
Home Values in the Area
Average Home Value in this Area
Purchase History
| Date | Buyer | Sale Price | Title Company |
|---|---|---|---|
| Nystrom Ricky E | -- | Fidelity National Title Co | |
| The Ricky Eugene Nystrom & Hannah Wedgel | -- | None Available | |
| Nystrom Ricky E | $630,000 | Placer Title Company |
Source: Public Records
Mortgage History
| Date | Status | Borrower | Loan Amount |
|---|---|---|---|
| Open | Nystrom Ricky E | $725,000 | |
| Closed | Nystrom Ricky E | $567,000 |
Source: Public Records
Tax History Compared to Growth
Tax History
| Year | Tax Paid | Tax Assessment Tax Assessment Total Assessment is a certain percentage of the fair market value that is determined by local assessors to be the total taxable value of land and additions on the property. | Land | Improvement |
|---|---|---|---|---|
| 2025 | $11,020 | $775,787 | $664,966 | $110,821 |
| 2024 | $11,020 | $760,577 | $651,928 | $108,649 |
| 2023 | $10,818 | $745,665 | $639,146 | $106,519 |
| 2022 | $10,657 | $731,045 | $626,614 | $104,431 |
| 2021 | $10,615 | $716,712 | $614,328 | $102,384 |
| 2019 | $9,965 | $695,456 | $596,107 | $99,349 |
| 2018 | $9,622 | $681,820 | $584,419 | $97,401 |
| 2017 | $9,470 | $668,452 | $572,960 | $95,492 |
| 2016 | $9,439 | $655,346 | $561,726 | $93,620 |
| 2015 | $9,474 | $645,503 | $553,289 | $92,214 |
| 2014 | $9,327 | $632,859 | $542,451 | $90,408 |
Source: Public Records
Map
Nearby Homes
- 63 Eureka Ave
- 39 Anson Way
- 857 Sea View Dr
- 506 Clayton Ave
- 7347 Terrace Dr
- 556 Norvell St
- 876 Balra Dr
- 7553 Stockton Ave
- 716 Gelston Place
- 545 Everett St
- 444 Richmond St
- 7788 Moeser Ln
- 700 Coventry Rd
- 716 Coventry Rd
- 618 Liberty St
- 201 Amherst Ave
- 19 Highland Blvd
- 1034 Navellier St
- 158 Lawson Rd
- 6727 Waldo Ave