F
Seller's Agent in 2022
Flora Huang
Evergreen Properties
(512) 751-9964
2 in this area
26 Total Sales
Estimated Value: $337,000 - $440,000
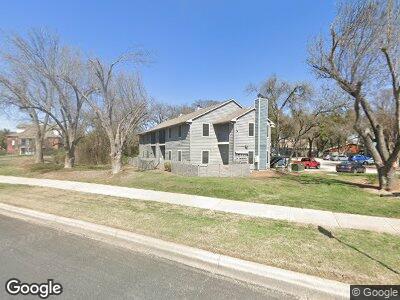
Adorable 3 bedroom townhome in a gated community with open floor plan and high ceiling. Beautiful kitchen with granite counters, walk-in pantry and opens to family room. Master down. Cozy living room with a fire place and wood floor. Spacious bedrooms. Conveniently located with easy access to 183, Parmer, shopping and major employers. Acclaimed schools!!
| Date | Buyer | Sale Price | Title Company |
|---|---|---|---|
| Gwo Jin Chywan | -- | Chicago Title | |
| Peebles Nancy C | -- | Gracy |
| Date | Status | Borrower | Loan Amount |
|---|---|---|---|
| Previous Owner | Peebles Nancy C | $213,839 |
| Date | Event | Price | Change | Sq Ft Price |
|---|---|---|---|---|
| 01/19/2022 01/19/22 | Rented | $1,895 | 0.0% | -- |
| 01/13/2022 01/13/22 | Under Contract | -- | -- | -- |
| 12/14/2021 12/14/21 | For Rent | $1,895 | +8.3% | -- |
| 12/29/2020 12/29/20 | Rented | $1,750 | 0.0% | -- |
| 12/29/2020 12/29/20 | Under Contract | -- | -- | -- |
| 12/04/2020 12/04/20 | For Rent | $1,750 | +9.7% | -- |
| 12/01/2018 12/01/18 | Rented | $1,595 | 0.0% | -- |
| 11/20/2018 11/20/18 | Under Contract | -- | -- | -- |
| 10/25/2018 10/25/18 | Price Changed | $1,595 | -5.9% | $1 / Sq Ft |
| 08/27/2018 08/27/18 | Price Changed | $1,695 | -5.6% | $1 / Sq Ft |
| 07/10/2018 07/10/18 | For Rent | $1,795 | 0.0% | -- |
| 08/12/2015 08/12/15 | Rented | $1,795 | 0.0% | -- |
| 07/23/2015 07/23/15 | Under Contract | -- | -- | -- |
| 06/15/2015 06/15/15 | For Rent | $1,795 | 0.0% | -- |
| 06/12/2015 06/12/15 | Sold | -- | -- | -- |
| 05/25/2015 05/25/15 | Pending | -- | -- | -- |
| 05/23/2015 05/23/15 | Off Market | -- | -- | -- |
| 05/20/2015 05/20/15 | Price Changed | $228,500 | -4.8% | $126 / Sq Ft |
| 05/16/2015 05/16/15 | For Sale | $240,000 | 0.0% | $132 / Sq Ft |
| 05/02/2015 05/02/15 | For Sale | $240,000 | 0.0% | $132 / Sq Ft |
| 05/01/2015 05/01/15 | Pending | -- | -- | -- |
| 04/17/2015 04/17/15 | For Sale | $240,000 | 0.0% | $132 / Sq Ft |
| 04/04/2015 04/04/15 | Off Market | -- | -- | -- |
| 03/28/2015 03/28/15 | For Sale | $240,000 | -- | $132 / Sq Ft |
| Year | Tax Paid | Tax Assessment Tax Assessment Total Assessment is a certain percentage of the fair market value that is determined by local assessors to be the total taxable value of land and additions on the property. | Land | Improvement |
|---|---|---|---|---|
| 2024 | $8,267 | $437,613 | $82,404 | $355,209 |
| 2023 | $7,604 | $409,278 | $82,404 | $326,874 |
| 2022 | $9,395 | $465,773 | $55,000 | $410,773 |
| 2021 | $7,661 | $327,509 | $43,002 | $284,507 |
| 2020 | $5,863 | $259,271 | $35,501 | $223,770 |
| 2019 | $6,025 | $258,681 | $35,880 | $222,801 |
| 2018 | $6,037 | $259,218 | $25,089 | $234,129 |
| 2017 | $5,527 | $232,958 | $25,089 | $207,869 |
| 2016 | $5,335 | $224,858 | $25,089 | $199,769 |
| 2015 | $4,383 | $195,423 | $25,089 | $170,334 |
| 2014 | $4,383 | $181,188 | $0 | $0 |
F
Seller's Agent in 2022
Flora Huang
Evergreen Properties
(512) 751-9964
2 in this area
26 Total Sales
K
Buyer's Agent in 2022
Kaylee LeBaron
Texas Ally Real Estate
(512) 552-7685

Buyer's Agent in 2020
Marni Kempf
Baemayr Realty Group, LLC
(512) 458-0269
19 Total Sales
Buyer's Agent in 2018
Kelly Siegler
Team Price Real Estate
(512) 667-4214
2 in this area
63 Total Sales
Seller Co-Listing Agent in 2015
Maryleigh Dejernett
All Access Austin
(512) 413-6404
2 in this area
68 Total Sales
W
Buyer's Agent in 2015
Wendy St. Thomas
StThomas Realty
(512) 925-3271