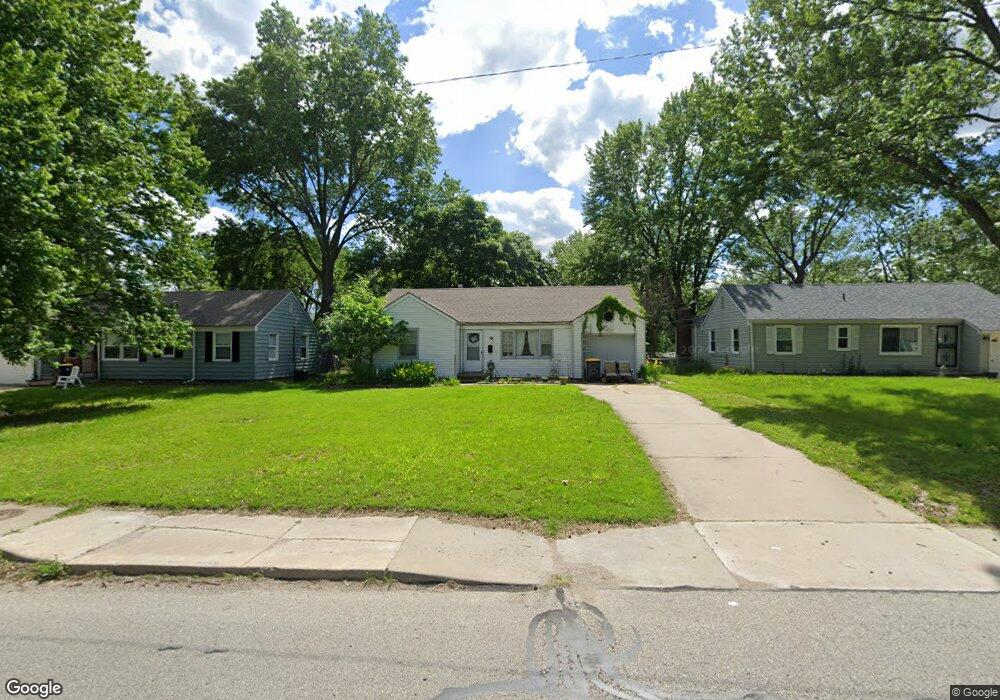
7709 Sni A Bar Rd Kansas City, MO 64129
Eastwood Hills East NeighborhoodEstimated Value: $123,720 - $150,000
3
Beds
1
Bath
942
Sq Ft
$144/Sq Ft
Est. Value
About This Home
This home is located at 7709 Sni A Bar Rd, Kansas City, MO 64129 and is currently estimated at $135,430, approximately $143 per square foot. 7709 Sni A Bar Rd is a home located in Jackson County with nearby schools including Eastwood Hills Elementary, Raytown Middle School, and Raytown South High School.
Ownership History
Date
Name
Owned For
Owner Type
Purchase Details
Closed on
Oct 11, 2016
Sold by
Benchmark Properties Vii Llc
Bought by
Csma Blt Llc
Current Estimated Value
Purchase Details
Closed on
Aug 10, 2011
Sold by
Peoples Bank Of The Ozarks
Bought by
Benchmark Properties Vii Llc
Purchase Details
Closed on
Jul 12, 2011
Sold by
Ventresca Melissa D and Ventresca Roderic C
Bought by
Peoples Bank Of The Ozarks
Purchase Details
Closed on
Jun 25, 2002
Sold by
Ventresca Melissa D and Roston Melissa
Bought by
Ventresca Roderic C and Ventresca Melissa D
Home Financials for this Owner
Home Financials are based on the most recent Mortgage that was taken out on this home.
Original Mortgage
$46,500
Interest Rate
7%
Mortgage Type
Purchase Money Mortgage
Purchase Details
Closed on
Oct 1, 1998
Sold by
Lois Blades and Lois Leslie I
Bought by
Batliner Dan and Phillips Jeff
Create a Home Valuation Report for This Property
The Home Valuation Report is an in-depth analysis detailing your home's value as well as a comparison with similar homes in the area
Home Values in the Area
Average Home Value in this Area
Purchase History
| Date | Buyer | Sale Price | Title Company |
|---|---|---|---|
| Csma Blt Llc | -- | Secured Title Of Kansas City | |
| Benchmark Properties Vii Llc | -- | Continental Title | |
| Peoples Bank Of The Ozarks | $15,000 | None Available | |
| Ventresca Roderic C | -- | Security Land Title Company | |
| Batliner Dan | -- | -- |
Source: Public Records
Mortgage History
| Date | Status | Borrower | Loan Amount |
|---|---|---|---|
| Previous Owner | Ventresca Roderic C | $46,500 |
Source: Public Records
Tax History Compared to Growth
Tax History
| Year | Tax Paid | Tax Assessment Tax Assessment Total Assessment is a certain percentage of the fair market value that is determined by local assessors to be the total taxable value of land and additions on the property. | Land | Improvement |
|---|---|---|---|---|
| 2025 | $1,044 | $9,799 | $2,172 | $7,627 |
| 2024 | $1,038 | $11,537 | $1,528 | $10,009 |
| 2023 | $1,038 | $11,537 | $1,305 | $10,232 |
| 2022 | $693 | $7,410 | $1,530 | $5,880 |
| 2021 | $693 | $7,410 | $1,530 | $5,880 |
| 2020 | $695 | $7,339 | $1,530 | $5,809 |
| 2019 | $682 | $7,339 | $1,530 | $5,809 |
| 2018 | $616 | $6,660 | $1,836 | $4,824 |
| 2017 | $616 | $6,660 | $1,836 | $4,824 |
| 2016 | $602 | $6,556 | $1,957 | $4,599 |
| 2014 | $587 | $6,365 | $1,900 | $4,465 |
Source: Public Records
Map
Nearby Homes
- 7803 E 50th Terrace
- 5002 Skiles Ave
- 4701 Skiles Ave
- 7605 Sni A Bar Terrace
- 5132 Skiles Ave
- 4958 Marsh Ave
- 7509 E 50th St
- 7504 E 49th St
- 7700 E 48th Terrace
- 7525 E 52nd St
- 7405 E 49th St
- 7615 E 48th St
- 4949 Laramie Ln
- 4881 Wallace Ave
- 5117 Booth Ave
- 5119 Booth Ave
- 5140 Booth Ave
- 7152 Sni A Bar Rd
- 8705 E 53rd Terrace
- 6876 Sni A Bar Rd
- 7711 Sni A Bar Rd
- 7707 Sni A Bar Rd
- 7713 Sni A Bar Rd
- 7705 Sni A Bar Rd
- 5017 Manchester Ave
- 7715 Sni A Bar Rd
- 7704 Sni A Bar Rd
- 7706 Sni A Bar Rd
- 5019 Manchester Ave
- 7703 Sni A Bar Rd
- 5015 Manchester Ave
- 7708 Sni A Bar Rd
- 5021 Manchester Ave
- 5013 Manchester Ave
- 7702 Sni A Bar Rd
- 7710 Sni A Bar Rd
- 7701 Sni A Bar Rd
- 7717 Sni A Bar Rd
- 5023 Manchester Ave
- 7622 Sni A Bar Rd