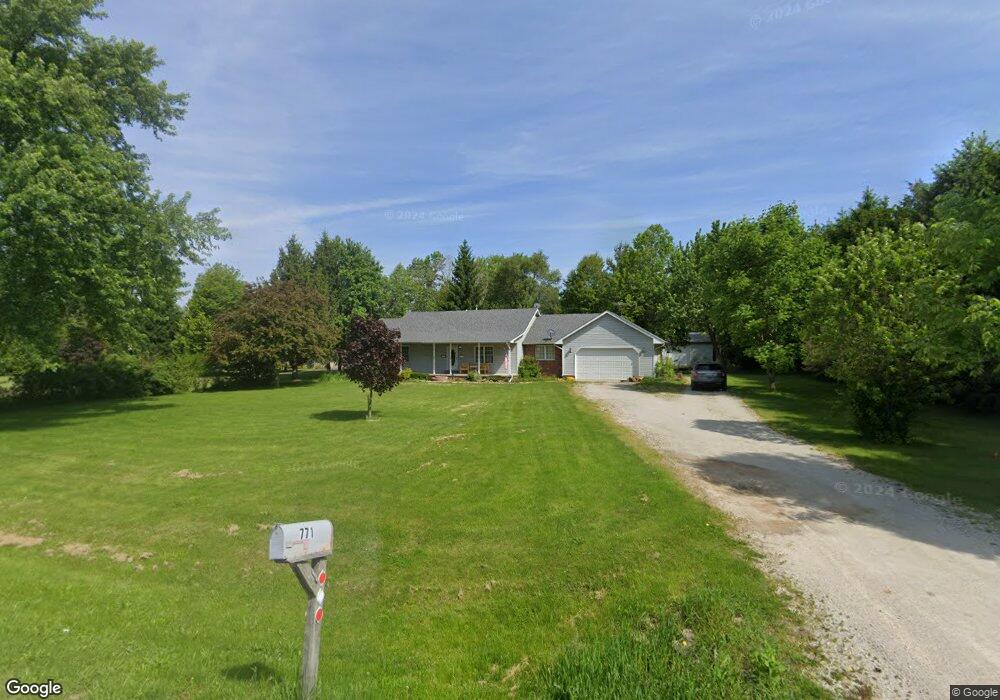
771 W 800 S Hebron, IN 46341
Porter County NeighborhoodEstimated Value: $385,000 - $444,000
3
Beds
3
Baths
2,160
Sq Ft
$188/Sq Ft
Est. Value
About This Home
This home is located at 771 W 800 S, Hebron, IN 46341 and is currently estimated at $406,324, approximately $188 per square foot. 771 W 800 S is a home located in Porter County with nearby schools including Hebron Elementary School, Hebron Middle School, and Hebron High School.
Ownership History
Date
Name
Owned For
Owner Type
Purchase Details
Closed on
Jul 29, 2019
Sold by
Singleton James and Singleton Carol
Bought by
Emmanuel Baptist Church Of Hebron Inc
Current Estimated Value
Home Financials for this Owner
Home Financials are based on the most recent Mortgage that was taken out on this home.
Original Mortgage
$506,836
Outstanding Balance
$444,168
Interest Rate
3.73%
Mortgage Type
Commercial
Estimated Equity
-$37,844
Create a Home Valuation Report for This Property
The Home Valuation Report is an in-depth analysis detailing your home's value as well as a comparison with similar homes in the area
Home Values in the Area
Average Home Value in this Area
Purchase History
| Date | Buyer | Sale Price | Title Company |
|---|---|---|---|
| Emmanuel Baptist Church Of Hebron Inc | $280,000 | Chicago Title Company Llc |
Source: Public Records
Mortgage History
| Date | Status | Borrower | Loan Amount |
|---|---|---|---|
| Open | Emmanuel Baptist Church Of Hebron Inc | $506,836 |
Source: Public Records
Tax History Compared to Growth
Tax History
| Year | Tax Paid | Tax Assessment Tax Assessment Total Assessment is a certain percentage of the fair market value that is determined by local assessors to be the total taxable value of land and additions on the property. | Land | Improvement |
|---|---|---|---|---|
| 2024 | $230 | $330,700 | $47,600 | $283,100 |
| 2023 | $230 | $320,000 | $44,500 | $275,500 |
| 2022 | $230 | $314,100 | $43,300 | $270,800 |
| 2021 | $230 | $257,000 | $42,700 | $214,300 |
| 2020 | $140 | $242,900 | $40,800 | $202,100 |
| 2019 | $3,004 | $234,900 | $41,600 | $193,300 |
| 2018 | $2,830 | $212,300 | $41,700 | $170,600 |
| 2017 | $2,861 | $218,200 | $42,400 | $175,800 |
| 2016 | $2,679 | $214,800 | $47,800 | $167,000 |
| 2014 | $2,630 | $210,100 | $46,500 | $163,600 |
| 2013 | -- | $212,300 | $49,200 | $163,100 |
Source: Public Records
Map
Nearby Homes
- 0 State Road 2 Unit NRA828209
- 0 S 725 W Unit 202439184
- 602 W Jackson St
- 587 Marcella St
- 585 Marcella St
- 594 Petry St
- 423 Fry St
- 425 Fry St
- 431 Fry St
- 596 Petry St
- 454 Fry St
- 433 Fry St
- 598 Ensign Place
- 444 Fry St
- 435 Fry St
- 419 Bricker St
- 604 Ensign Place
- Sydney Basement Plan at Park Ridge
- Harmony Basement Plan at Park Ridge
- Henley Basement Plan at Park Ridge
- 773 W 800 S
- 777 W 800 S
- 778 W 800 S
- 779 W 800 S
- 755 W 800 S
- 752 W 800 S
- 14724 Montgomery St
- 803 W Sigler St
- 804 W Sigler St
- 106 N Harrison St
- 713 W Church St
- 802 W Sigler St
- 801 W Sigler St
- 715 W Church St
- 710 W Sigler St
- 202 S Harrison St
- 711 W Church St
- 204 S Harrison St
- 206 S Harrison St
- 708 W Sigler St