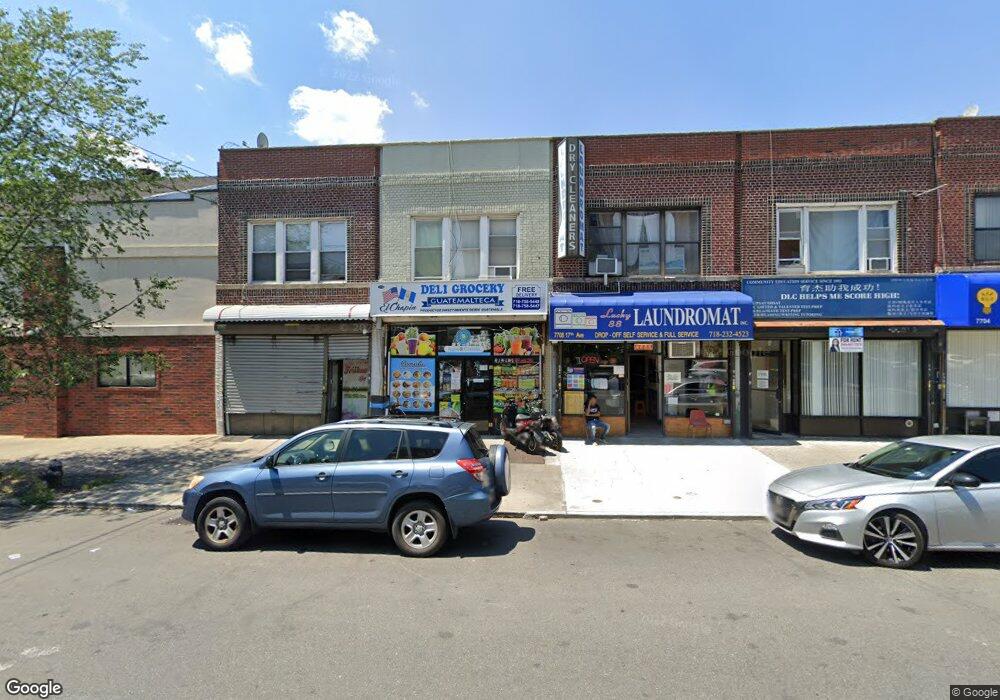
7710 17th Ave Unit Building Brooklyn, NY 11214
Bensonhurst NeighborhoodEstimated Value: $1,033,540
--
Bed
3
Baths
1,792
Sq Ft
$577/Sq Ft
Est. Value
About This Home
This home is located at 7710 17th Ave Unit Building, Brooklyn, NY 11214 and is currently estimated at $1,033,540, approximately $576 per square foot. 7710 17th Ave Unit Building is a home located in Kings County with nearby schools including P.S. 204 Vince Lombardi, Junior High School 227 Edward B Shallow, and New Utrecht High School.
Ownership History
Date
Name
Owned For
Owner Type
Purchase Details
Closed on
Aug 26, 2015
Sold by
Mbl Brothers Holdings Llc
Bought by
82 Tang Realty Corp
Current Estimated Value
Home Financials for this Owner
Home Financials are based on the most recent Mortgage that was taken out on this home.
Original Mortgage
$310,000
Outstanding Balance
$244,313
Interest Rate
4.01%
Mortgage Type
Commercial
Estimated Equity
$789,227
Purchase Details
Closed on
Jun 12, 2014
Sold by
Martino Joseph
Bought by
Mbl Brothers Holdings Llc
Home Financials for this Owner
Home Financials are based on the most recent Mortgage that was taken out on this home.
Original Mortgage
$496,500
Interest Rate
4.16%
Mortgage Type
Commercial
Purchase Details
Closed on
Jan 29, 2014
Sold by
Frank Martino Trust
Bought by
Martino Joseph
Create a Home Valuation Report for This Property
The Home Valuation Report is an in-depth analysis detailing your home's value as well as a comparison with similar homes in the area
Home Values in the Area
Average Home Value in this Area
Purchase History
| Date | Buyer | Sale Price | Title Company |
|---|---|---|---|
| 82 Tang Realty Corp | $820,000 | -- | |
| Mbl Brothers Holdings Llc | $499,500 | -- | |
| Martino Joseph | -- | -- |
Source: Public Records
Mortgage History
| Date | Status | Borrower | Loan Amount |
|---|---|---|---|
| Open | 82 Tang Realty Corp | $310,000 | |
| Previous Owner | Mbl Brothers Holdings Llc | $496,500 |
Source: Public Records
Tax History Compared to Growth
Tax History
| Year | Tax Paid | Tax Assessment Tax Assessment Total Assessment is a certain percentage of the fair market value that is determined by local assessors to be the total taxable value of land and additions on the property. | Land | Improvement |
|---|---|---|---|---|
| 2025 | $7,707 | $59,580 | $13,740 | $45,840 |
| 2024 | $7,707 | $55,380 | $13,740 | $41,640 |
| 2023 | $7,352 | $59,160 | $13,740 | $45,420 |
| 2022 | $7,141 | $55,320 | $13,740 | $41,580 |
| 2021 | $7,528 | $50,880 | $13,740 | $37,140 |
| 2020 | $3,546 | $55,200 | $13,740 | $41,460 |
| 2019 | $6,689 | $55,200 | $13,740 | $41,460 |
| 2018 | $6,150 | $30,168 | $8,014 | $22,154 |
| 2017 | $6,076 | $29,808 | $8,490 | $21,318 |
| 2016 | $5,959 | $29,808 | $10,188 | $19,620 |
| 2015 | $3,392 | $28,246 | $10,709 | $17,537 |
| 2014 | $3,392 | $26,648 | $12,132 | $14,516 |
Source: Public Records
Map
Nearby Homes
- 7706 17th Ave
- 7705 New Utrecht Ave
- 1717 78th St
- 1655 78th St
- 1717 79th St
- 1740 77th St
- 1651 79th St
- 1621 78th St
- 7507 New Utrecht Ave
- 1726 79th St
- 1738 79th St
- 1748 79th St
- 8001 New Utrecht Ave
- 1764 79th St
- 1702 74th St
- 7718 16th Ave
- 1759 Bay Ridge Pkwy Unit 2B
- 7902 16th Ave
- 1566 76th St
- 1723 74th St
- 7710 17th Ave
- 7708 17th Ave
- 7712 17th Ave
- 7704 17th Ave
- 7702 17th Ave
- 7709 New Utrecht Ave
- 7715-7725 New Utrecht Ave
- 7703 New Utrecht Ave
- 7701 17 Ave
- 7701 New Utrecht Ave
- 1702-1704 77th St
- 7624 17th Ave Unit STORE
- 7624 17th Ave
- 1701 78th St
- 7622 17th Ave Unit 1
- 7622 17th Ave
- 1703 78th St
- 7620 17th Ave
- 1705 78th St
- 7802 17th Ave