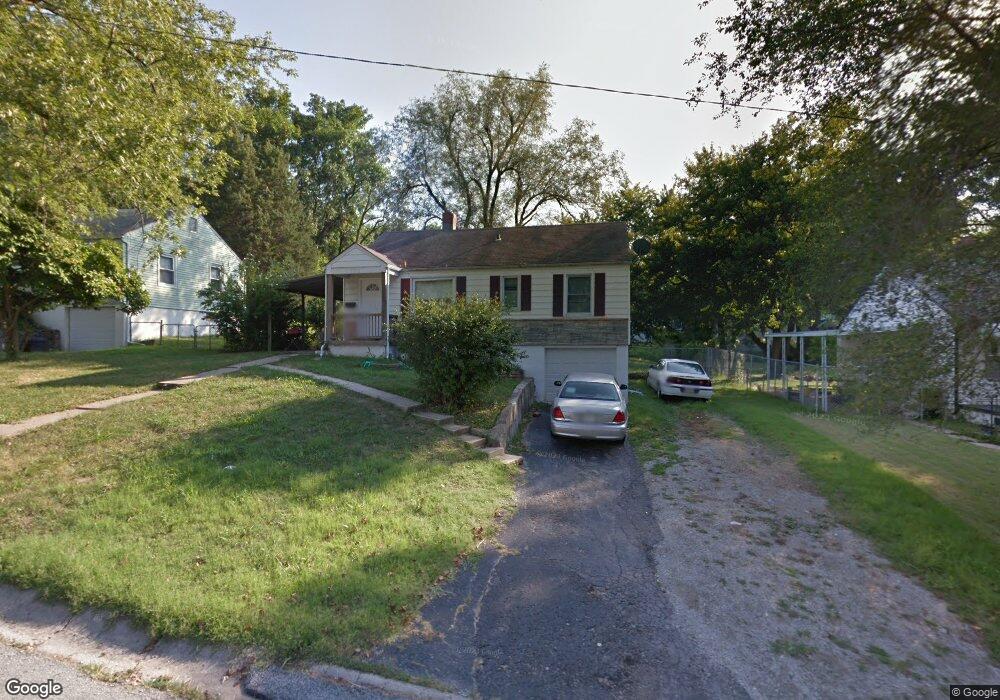
7711 Sni A Bar Terrace Kansas City, MO 64129
Eastwood Hills East NeighborhoodEstimated Value: $104,000 - $145,000
3
Beds
1
Bath
816
Sq Ft
$159/Sq Ft
Est. Value
About This Home
This home is located at 7711 Sni A Bar Terrace, Kansas City, MO 64129 and is currently estimated at $129,947, approximately $159 per square foot. 7711 Sni A Bar Terrace is a home located in Jackson County with nearby schools including Eastwood Hills Elementary, Raytown Middle School, and Raytown South High School.
Ownership History
Date
Name
Owned For
Owner Type
Purchase Details
Closed on
Aug 14, 2024
Sold by
Martin Underground Llc
Bought by
York Dwain R
Current Estimated Value
Purchase Details
Closed on
Feb 20, 2014
Sold by
Park Robert D and Park Jaclyn
Bought by
Martin Underground Llc
Purchase Details
Closed on
Apr 6, 2007
Sold by
Doss David A and Doss Marsha A
Bought by
Park Robert D
Home Financials for this Owner
Home Financials are based on the most recent Mortgage that was taken out on this home.
Original Mortgage
$50,000
Interest Rate
10.25%
Mortgage Type
Purchase Money Mortgage
Purchase Details
Closed on
Feb 26, 2003
Sold by
Doss David A and Doss Marsha A
Bought by
Levy Michelle R and Franklin Janet M
Home Financials for this Owner
Home Financials are based on the most recent Mortgage that was taken out on this home.
Original Mortgage
$40,000
Interest Rate
7%
Mortgage Type
Seller Take Back
Create a Home Valuation Report for This Property
The Home Valuation Report is an in-depth analysis detailing your home's value as well as a comparison with similar homes in the area
Home Values in the Area
Average Home Value in this Area
Purchase History
| Date | Buyer | Sale Price | Title Company |
|---|---|---|---|
| York Dwain R | -- | None Listed On Document | |
| Martin Underground Llc | -- | None Available | |
| Park Robert D | -- | Commonwealth Land Title Insu | |
| Levy Michelle R | -- | Ati Title Company |
Source: Public Records
Mortgage History
| Date | Status | Borrower | Loan Amount |
|---|---|---|---|
| Previous Owner | Park Robert D | $50,000 | |
| Previous Owner | Levy Michelle R | $40,000 | |
| Closed | Levy Michelle R | $975 |
Source: Public Records
Tax History Compared to Growth
Tax History
| Year | Tax Paid | Tax Assessment Tax Assessment Total Assessment is a certain percentage of the fair market value that is determined by local assessors to be the total taxable value of land and additions on the property. | Land | Improvement |
|---|---|---|---|---|
| 2025 | $951 | $10,051 | $2,314 | $7,737 |
| 2024 | $951 | $10,503 | $1,632 | $8,871 |
| 2023 | $945 | $10,503 | $1,351 | $9,152 |
| 2022 | $711 | $7,600 | $1,710 | $5,890 |
| 2021 | $711 | $7,600 | $1,710 | $5,890 |
| 2020 | $723 | $7,634 | $1,710 | $5,924 |
| 2019 | $709 | $7,634 | $1,710 | $5,924 |
| 2018 | $610 | $6,597 | $1,786 | $4,811 |
| 2017 | $610 | $6,597 | $1,786 | $4,811 |
| 2016 | $586 | $6,380 | $1,957 | $4,423 |
| 2014 | -- | $6,194 | $1,900 | $4,294 |
Source: Public Records
Map
Nearby Homes
- 5002 Skiles Ave
- 7803 E 50th Terrace
- 7605 Sni A Bar Terrace
- 4701 Skiles Ave
- 4958 Marsh Ave
- 5132 Skiles Ave
- 7509 E 50th St
- 7700 E 48th Terrace
- 7504 E 49th St
- 7405 E 49th St
- 7615 E 48th St
- 7525 E 52nd St
- 4949 Laramie Ln
- 4881 Wallace Ave
- 5117 Booth Ave
- 5119 Booth Ave
- 5140 Booth Ave
- 7152 Sni A Bar Rd
- 6876 Sni A Bar Rd
- 8705 E 53rd Terrace
- 7713 Sni A Bar Terrace
- 7709 Sni A Bar Terrace
- 7707 Sni A Bar Terrace
- 7715 Sni A Bar Terrace
- 7710 Sni A Bar Terrace
- 7712 Sni A Bar Terrace
- 7708 Sni A Bar Terrace
- 7705 Sni A Bar Terrace
- 7710 Sni A Bar Rd
- 7712 Sni A Bar Rd
- 7717 Sni A Bar Terrace
- 7708 Sni A Bar Rd
- 7704 Sni A Bar Terrace
- 7714 Sni A Bar Terrace
- 7714 Sni A Bar Rd
- 7716 Sni A Bar Terrace
- 7706 Sni A Bar Rd
- 7703 Sni A Bar Terrace
- 7719 Sni A Bar Terrace
- 7716 Sni A Bar Rd