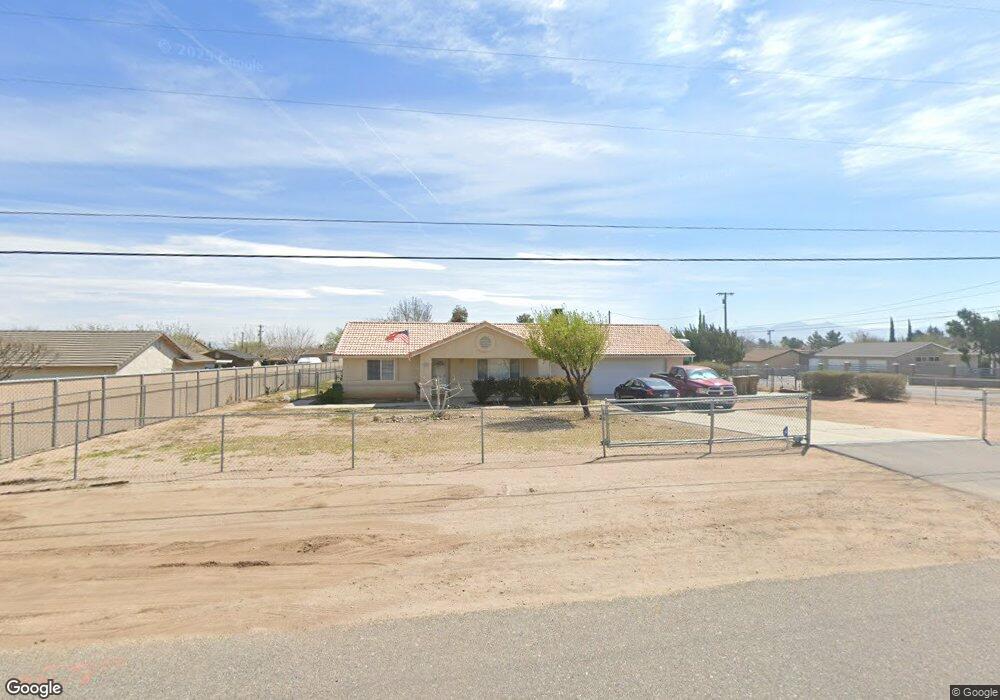
7711 Victor Ave Hesperia, CA 92345
Estimated Value: $401,987 - $529,000
3
Beds
2
Baths
1,317
Sq Ft
$337/Sq Ft
Est. Value
About This Home
This home is located at 7711 Victor Ave, Hesperia, CA 92345 and is currently estimated at $443,497, approximately $336 per square foot. 7711 Victor Ave is a home located in San Bernardino County with nearby schools including Cottonwood Elementary School, Cedar Middle School, and Oak Hills High School.
Ownership History
Date
Name
Owned For
Owner Type
Purchase Details
Closed on
Feb 23, 2021
Sold by
Morrell Richard J and Morrell Denise D
Bought by
Morrell Richard J and Morrell Denise D
Current Estimated Value
Purchase Details
Closed on
Jun 19, 2017
Sold by
Simmons Pamela M
Bought by
Morrell Richard J and Morrell Denise D
Home Financials for this Owner
Home Financials are based on the most recent Mortgage that was taken out on this home.
Original Mortgage
$176,000
Outstanding Balance
$146,073
Interest Rate
3.94%
Mortgage Type
New Conventional
Estimated Equity
$297,424
Purchase Details
Closed on
May 14, 2001
Sold by
Mcenulty James W
Bought by
Simmons Pamela M
Home Financials for this Owner
Home Financials are based on the most recent Mortgage that was taken out on this home.
Original Mortgage
$75,000
Interest Rate
7.14%
Purchase Details
Closed on
Jan 9, 2001
Sold by
Gentry Edward J
Bought by
Mcenulty James W and Mcenulty Denise L
Purchase Details
Closed on
Feb 18, 2000
Sold by
Husnian Azad
Bought by
Gentry Edward J and Gentry Anne Marie
Create a Home Valuation Report for This Property
The Home Valuation Report is an in-depth analysis detailing your home's value as well as a comparison with similar homes in the area
Home Values in the Area
Average Home Value in this Area
Purchase History
| Date | Buyer | Sale Price | Title Company |
|---|---|---|---|
| Morrell Richard J | -- | None Available | |
| Morrell Richard J | $220,000 | Chicago Title Company | |
| Simmons Pamela M | $111,000 | Commonwealth Land Title Co | |
| Mcenulty James W | $20,000 | Commonwealth Land Title Co | |
| Gentry Edward J | -- | -- |
Source: Public Records
Mortgage History
| Date | Status | Borrower | Loan Amount |
|---|---|---|---|
| Open | Morrell Richard J | $176,000 | |
| Previous Owner | Simmons Pamela M | $75,000 |
Source: Public Records
Tax History Compared to Growth
Tax History
| Year | Tax Paid | Tax Assessment Tax Assessment Total Assessment is a certain percentage of the fair market value that is determined by local assessors to be the total taxable value of land and additions on the property. | Land | Improvement |
|---|---|---|---|---|
| 2025 | $2,747 | $250,323 | $50,065 | $200,258 |
| 2024 | $2,747 | $245,414 | $49,083 | $196,331 |
| 2023 | $2,717 | $240,602 | $48,121 | $192,481 |
| 2022 | $2,655 | $235,884 | $47,177 | $188,707 |
| 2021 | $2,607 | $231,259 | $46,252 | $185,007 |
| 2020 | $2,576 | $228,888 | $45,778 | $183,110 |
| 2019 | $2,523 | $224,400 | $44,880 | $179,520 |
| 2018 | $2,475 | $220,000 | $44,000 | $176,000 |
| 2017 | $1,571 | $144,116 | $25,965 | $118,151 |
| 2016 | $1,537 | $141,290 | $25,456 | $115,834 |
| 2015 | -- | $139,168 | $25,074 | $114,094 |
| 2014 | $1,495 | $136,442 | $24,583 | $111,859 |
Source: Public Records
Map
Nearby Homes
- 14624 El Centro St
- 7795 Oakwood Ave
- 0 Situs Address Unit PW25230513
- 0 Parcel# 0405-042-21-0-000 Unit HD25110608
- 0 Bear Valley Unit HD25248981
- 0 C Ave & Mauna Loa St Unit HD25149622
- Fleming Plan at Laurel at Silverwood
- 111 Starlight Dr
- 8853 Waltham Ave
- Agate Plan at Laurel at Silverwood
- 8864 Waltham Ave
- 395 State Hwy
- 8801 3rd Ave
- 8802 Waltham Ave
- 0 01n-11e-17 Unit CV25040184
- 17410 Whiskey Mountain
- 0 Tbv Unit HD25069247
- Foster Plan at Laurel at Silverwood
- 123 Main
- 0 Unit HD25170598
- 7725 Victor Ave
- 14651 El Centro St
- 7710 Oakwood Ave
- 7728 Oakwood Ave
- 7741 Victor Ave
- 7728 Victor Ave
- 7673 Victor Ave
- 7686 Victor Ave
- 7761 Victor Ave
- 7746 Victor Ave
- 7672 Oakwood Ave
- 7764 Oakwood Ave
- 7674 Victor Ave
- 7653 Victor Ave
- 7764 Victor Ave
- 7652 Oakwood Ave
- 7711 Oakwood Ave
- 14570 El Centro St
- 7773 Victor Ave