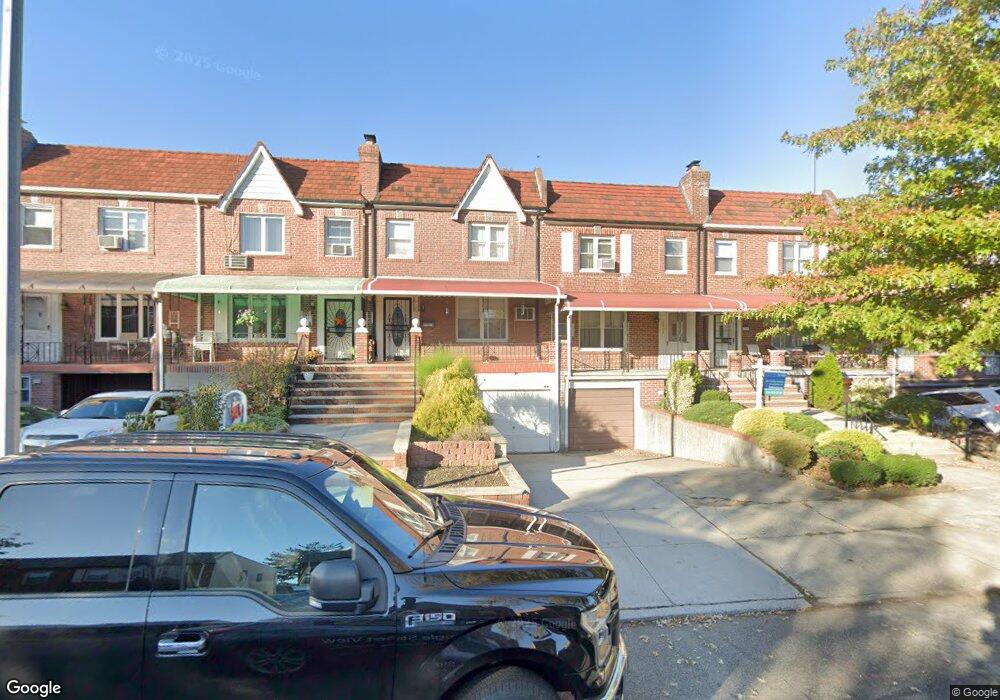
7712 85th St Glendale, NY 11385
Glendale NeighborhoodEstimated Value: $944,000 - $996,000
Studio
--
Bath
1,480
Sq Ft
$652/Sq Ft
Est. Value
About This Home
This home is located at 7712 85th St, Glendale, NY 11385 and is currently estimated at $964,667, approximately $651 per square foot. 7712 85th St is a home located in Queens County with nearby schools including P.S./I.S. 113 Anthony J. Pranzo School and Queens Metropolitan High School.
Ownership History
Date
Name
Owned For
Owner Type
Purchase Details
Closed on
Sep 18, 2018
Sold by
Frances M Griffin Revocable Trust Dated
Bought by
Suleyman Heydarov and Suleyman Sevil Heydarova
Current Estimated Value
Home Financials for this Owner
Home Financials are based on the most recent Mortgage that was taken out on this home.
Original Mortgage
$492,000
Outstanding Balance
$428,169
Interest Rate
4.5%
Mortgage Type
Purchase Money Mortgage
Estimated Equity
$536,498
Create a Home Valuation Report for This Property
The Home Valuation Report is an in-depth analysis detailing your home's value as well as a comparison with similar homes in the area
Home Values in the Area
Average Home Value in this Area
Purchase History
| Date | Buyer | Sale Price | Title Company |
|---|---|---|---|
| Suleyman Heydarov | $660,000 | -- |
Source: Public Records
Mortgage History
| Date | Status | Borrower | Loan Amount |
|---|---|---|---|
| Open | Suleyman Heydarov | $492,000 |
Source: Public Records
Tax History
| Year | Tax Paid | Tax Assessment Tax Assessment Total Assessment is a certain percentage of the fair market value that is determined by local assessors to be the total taxable value of land and additions on the property. | Land | Improvement |
|---|---|---|---|---|
| 2025 | $7,597 | $40,090 | $10,946 | $29,144 |
| 2024 | $7,597 | $37,822 | $10,913 | $26,909 |
| 2023 | $7,597 | $37,822 | $10,914 | $26,908 |
| 2022 | $7,623 | $51,180 | $14,700 | $36,480 |
| 2021 | $7,493 | $48,360 | $14,700 | $33,660 |
| 2020 | $7,071 | $47,160 | $14,700 | $32,460 |
| 2019 | $6,593 | $47,640 | $14,700 | $32,940 |
| 2018 | $2,553 | $31,518 | $12,218 | $19,300 |
| 2017 | $2,542 | $31,279 | $13,374 | $17,905 |
| 2016 | $2,328 | $31,279 | $13,374 | $17,905 |
| 2015 | $1,341 | $27,840 | $12,600 | $15,240 |
| 2014 | $1,341 | $26,265 | $11,486 | $14,779 |
Source: Public Records
Map
Nearby Homes
Your Personal Tour Guide
Ask me questions while you tour the home.