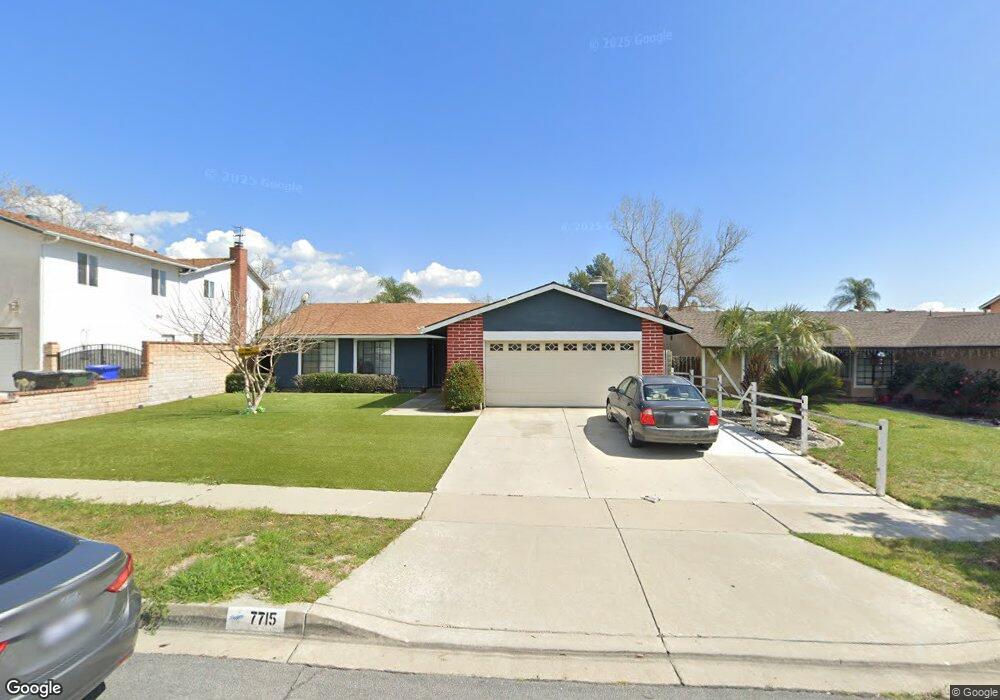
7715 Whitewood Dr Fontana, CA 92336
Estimated Value: $568,612 - $590,000
3
Beds
2
Baths
1,263
Sq Ft
$459/Sq Ft
Est. Value
About This Home
This home is located at 7715 Whitewood Dr, Fontana, CA 92336 and is currently estimated at $579,153, approximately $458 per square foot. 7715 Whitewood Dr is a home located in San Bernardino County with nearby schools including Tokay Elementary School, Almeria Middle School, and Fontana A. B. Miller High School.
Ownership History
Date
Name
Owned For
Owner Type
Purchase Details
Closed on
Nov 18, 2003
Sold by
Rodriguez Teodoro
Bought by
Gonzalez Felipe A and Rodriguez Olga R
Current Estimated Value
Purchase Details
Closed on
Aug 26, 2003
Sold by
Arangure Francisco J
Bought by
Rodriguez Teodoro and Rodriguez Yolanda
Home Financials for this Owner
Home Financials are based on the most recent Mortgage that was taken out on this home.
Original Mortgage
$138,000
Outstanding Balance
$61,188
Interest Rate
5.6%
Mortgage Type
Purchase Money Mortgage
Estimated Equity
$517,965
Purchase Details
Closed on
Jul 22, 1994
Sold by
Hud
Bought by
Rodriguez Teodoro and Rodriguez Yolanda
Home Financials for this Owner
Home Financials are based on the most recent Mortgage that was taken out on this home.
Original Mortgage
$110,920
Interest Rate
8.8%
Mortgage Type
FHA
Purchase Details
Closed on
Feb 7, 1994
Sold by
Cal Western Reconveyance Corp
Bought by
Keycorp Mtg Inc
Create a Home Valuation Report for This Property
The Home Valuation Report is an in-depth analysis detailing your home's value as well as a comparison with similar homes in the area
Home Values in the Area
Average Home Value in this Area
Purchase History
| Date | Buyer | Sale Price | Title Company |
|---|---|---|---|
| Gonzalez Felipe A | -- | -- | |
| Rodriguez Teodoro | -- | Landsafe | |
| Rodriguez Teodoro | $113,000 | Gateway Title Company | |
| Keycorp Mtg Inc | $147,461 | Stewart Title Co |
Source: Public Records
Mortgage History
| Date | Status | Borrower | Loan Amount |
|---|---|---|---|
| Open | Rodriguez Teodoro | $138,000 | |
| Previous Owner | Rodriguez Teodoro | $110,920 |
Source: Public Records
Tax History Compared to Growth
Tax History
| Year | Tax Paid | Tax Assessment Tax Assessment Total Assessment is a certain percentage of the fair market value that is determined by local assessors to be the total taxable value of land and additions on the property. | Land | Improvement |
|---|---|---|---|---|
| 2025 | $3,284 | $231,892 | $59,929 | $171,963 |
| 2024 | $3,284 | $227,345 | $58,754 | $168,591 |
| 2023 | $3,190 | $222,887 | $57,602 | $165,285 |
| 2022 | $3,139 | $218,517 | $56,473 | $162,044 |
| 2021 | $3,084 | $214,233 | $55,366 | $158,867 |
| 2020 | $3,046 | $212,036 | $54,798 | $157,238 |
| 2019 | $2,956 | $207,879 | $53,724 | $154,155 |
| 2018 | $3,453 | $203,803 | $52,671 | $151,132 |
| 2017 | $2,578 | $199,807 | $51,638 | $148,169 |
| 2016 | $2,515 | $195,889 | $50,625 | $145,264 |
| 2015 | $2,467 | $192,947 | $49,865 | $143,082 |
| 2014 | $2,933 | $189,167 | $48,888 | $140,279 |
Source: Public Records
Map
Nearby Homes
- 7600 Jacaranda Ave
- 7575 Lime Ave
- 7541 Catawba Dr
- 16010 Ramona Dr
- 15575 Allspice Ln
- 7908 Tokay Ave Unit 108
- 15783 Barbee St Unit 10
- 7868 Sea Salt Ave
- 15677 Barbee St
- 7421 Catawba Dr
- 15752 Mimosa Ct
- 7434 Freeport Cir
- 0 Foothill Blvd Unit CV25217423
- 15457 Red Pepper Place
- 16045 Jackson Dr
- 15797 Foothill Blvd
- 15930 Chorus Ln
- 7801 Pinyon Ave
- 7798 Poppy Ln
- 7170 Melody Dr
- 7725 Whitewood Dr
- 7705 Whitewood Dr
- 7710 Almeria Ave
- 7735 Whitewood Dr
- 7700 Almeria Ave
- 7720 Almeria Ave
- 7730 Almeria Ave
- 7745 Whitewood Dr
- 7740 Almeria Ave
- 7720 Whitewood Dr
- 7667 Yellow Iris Ct
- 7666 Yellow Iris Ct
- 7700 Whitewood Dr
- 7755 Whitewood Dr
- 7730 Whitewood Dr
- 0 Miller Ave Unit TR18028154
- 0 Miller Ave Unit RS17255917
- 0 Miller Ave Unit C11130684
- 0 Miller Ave Unit CV13055867
- 0 Miller Ave Unit CV14001221