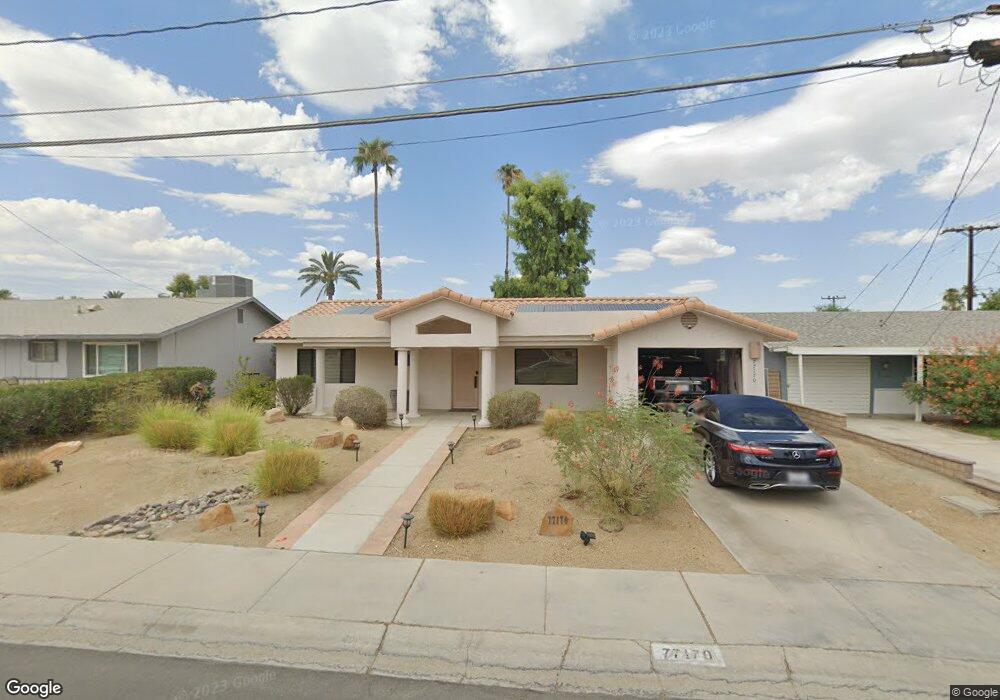
77170 New York Ave Palm Desert, CA 92211
Palm Desert Country NeighborhoodEstimated Value: $351,000 - $416,000
2
Beds
2
Baths
1,064
Sq Ft
$362/Sq Ft
Est. Value
About This Home
This home is located at 77170 New York Ave, Palm Desert, CA 92211 and is currently estimated at $385,090, approximately $361 per square foot. 77170 New York Ave is a home located in Riverside County with nearby schools including Gerald R. Ford Elementary School, Colonel Mitchell Paige Middle School, and Palm Desert High School.
Ownership History
Date
Name
Owned For
Owner Type
Purchase Details
Closed on
Jun 30, 2022
Sold by
Elizabeth Ash
Bought by
Elizabeth Ash Revocable Trust
Current Estimated Value
Purchase Details
Closed on
Feb 4, 2014
Sold by
Theige Kirk Cordell
Bought by
Ash Charles and Ash Elizabeth
Home Financials for this Owner
Home Financials are based on the most recent Mortgage that was taken out on this home.
Original Mortgage
$139,500
Interest Rate
3.62%
Mortgage Type
Adjustable Rate Mortgage/ARM
Purchase Details
Closed on
Sep 10, 2002
Sold by
Theige Darrell F and Theige Nancy L
Bought by
Theige Darrell F and Theige Nancy L
Purchase Details
Closed on
May 10, 1994
Sold by
Morris Charles Hilton and Morris Ruth Dorothy
Bought by
Theige Darrell F and Theige Nancy L
Home Financials for this Owner
Home Financials are based on the most recent Mortgage that was taken out on this home.
Original Mortgage
$42,000
Interest Rate
8.6%
Mortgage Type
Seller Take Back
Create a Home Valuation Report for This Property
The Home Valuation Report is an in-depth analysis detailing your home's value as well as a comparison with similar homes in the area
Home Values in the Area
Average Home Value in this Area
Purchase History
| Date | Buyer | Sale Price | Title Company |
|---|---|---|---|
| Elizabeth Ash Revocable Trust | -- | None Listed On Document | |
| Ash Charles | $186,000 | Orange Coast Title Co | |
| Theige Darrell F | -- | -- | |
| Theige Darrell F | $10,000 | -- |
Source: Public Records
Mortgage History
| Date | Status | Borrower | Loan Amount |
|---|---|---|---|
| Previous Owner | Ash Charles | $139,500 | |
| Previous Owner | Theige Darrell F | $42,000 |
Source: Public Records
Tax History Compared to Growth
Tax History
| Year | Tax Paid | Tax Assessment Tax Assessment Total Assessment is a certain percentage of the fair market value that is determined by local assessors to be the total taxable value of land and additions on the property. | Land | Improvement |
|---|---|---|---|---|
| 2025 | $3,497 | $227,996 | $79,795 | $148,201 |
| 2023 | $3,497 | $219,146 | $76,698 | $142,448 |
| 2022 | $3,246 | $214,850 | $75,195 | $139,655 |
| 2021 | $5,355 | $210,638 | $73,721 | $136,917 |
| 2020 | $5,304 | $208,480 | $72,966 | $135,514 |
| 2019 | $5,250 | $204,393 | $71,536 | $132,857 |
| 2018 | $5,197 | $200,386 | $70,135 | $130,251 |
| 2017 | $5,138 | $196,458 | $68,760 | $127,698 |
| 2016 | $2,886 | $192,607 | $67,412 | $125,195 |
| 2015 | $2,877 | $189,715 | $66,400 | $123,315 |
| 2014 | $2,431 | $164,670 | $60,852 | $103,818 |
Source: Public Records
Map
Nearby Homes
- 42915 Wisconsin Ave
- 43000 Connecticut St
- 42660 Iowa St
- 42700 Wisconsin Ave
- 77265 California Dr
- 42660 Wisconsin Ave
- 42725 Turqueries Ave
- 43305 Illinois Ave
- 42440 Kansas St
- 42935 Texas Ave
- 76948 Scimitar Way
- 42706 Liolios Dr
- 42405 Turqueries Ave
- 76914 Scimitar Way
- 77190 Minnesota Ave
- 77125 Indiana Ave
- 42588 Edessa St
- 77310 Minnesota Ave
- 43170 Warner Trail
- 76849 Maresh Ct
- 77160 New York Ave
- 77180 New York Ave
- 77150 New York Ave
- 77130 New York Ave
- 77180 California Dr
- 77179 California Dr
- 77181 California Dr
- 43000 Wisconsin Ave
- 77182 California Dr
- 42980 Wisconsin Ave
- 77183 California Dr
- 42815 Kansas St
- 77178 California Dr
- 42795 Kansas St
- 77184 California Dr
- 42960 Wisconsin Ave
- 42775 Kansas St
- 77176 California Dr
- 77185 California Dr
- 42985 Wisconsin Ave